matplotlib labeling pie-charts
python - How to have actual values in matplotlib Pie Chart displayed - Stack Overflow:
def absolute_value(val):
    a  = numpy.round(val/100.*sizes.sum(), 0)
    return a

plt.pie(sizes, labels=labels, colors=colors,
        autopct=absolute_value, shadow=True)
Can be also used to add more complex stuff inside the wedges (apparently the term for parts of the ‘pie’).
I did this:
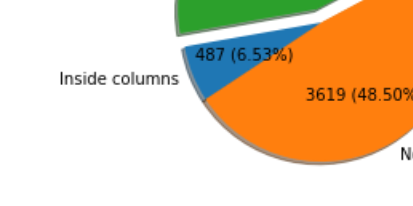
def absolute_value(val):
    a  = int(np.round(val/100.*np.array(sizes).sum(), 0))
    res = f"{a} ({val:.2f}%)"
    return res
for this:
Nel mezzo del deserto posso dire tutto quello che voglio.