matplotlib datetime axes indexing
If you have an axis indexed from timestamps and want to draw stuff there, you need to convert between datetimes and coordinates.
SO1 led me to matplotlib.dates — Matplotlib 3.7.1 documentation.
from matplotlib.dates import date2num
coordinate_float_value = date2num(your_timestamp)
# there's also num2date, etc.
Then you can do things like
g=sns.histplot(...)

g.axes.bar(x=date2num(timestamp),height=5,width=0.01)

#or
Ref:
- matplotlib.axes.Axes.bar — Matplotlib 3.7.1 documentation
- matplotlib.dates — Matplotlib 3.7.1 documentation
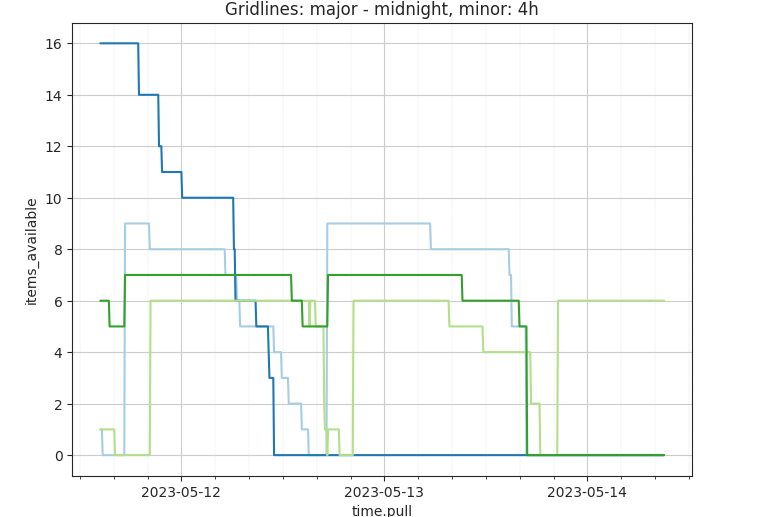
And, for later, gridlnes/dates fun I’ll document later maybe:
from matplotlib.dates import date2num, drange
from datetime import timedelta
import matplotlib.ticker as ticker

g = sns.lineplot(...)

# We create a grid located at midnight of each day
t_end = df_item['time.pull'].max().ceil(freq="D")
t_start = df_item['time.pull'].min().floor(freq="D")
dr_days = drange(t_start,t_end,delta=timedelta(days=1))
dr_hours = drange(t_start,t_end,delta=timedelta(hours=4))

g.axes.grid(True, axis='both',which='major')
g.axes.grid(True, axis='both',which='minor',linewidth=0.2,linestyle="--")
g.axes.xaxis.set_major_locator(ticker.FixedLocator(dr_days))
g.axes.xaxis.set_minor_locator(ticker.FixedLocator(dr_hours))
Nel mezzo del deserto posso dire tutto quello che voglio.