Pie Charts Considered Harmful
Note that seaborn doesn’t create pie charts, as seaborn’s author considers those to be unfit for statistical visualization. See e.g. Why you shouldn’t use pie charts – Johan 1
Why you shouldn’t use pie charts:
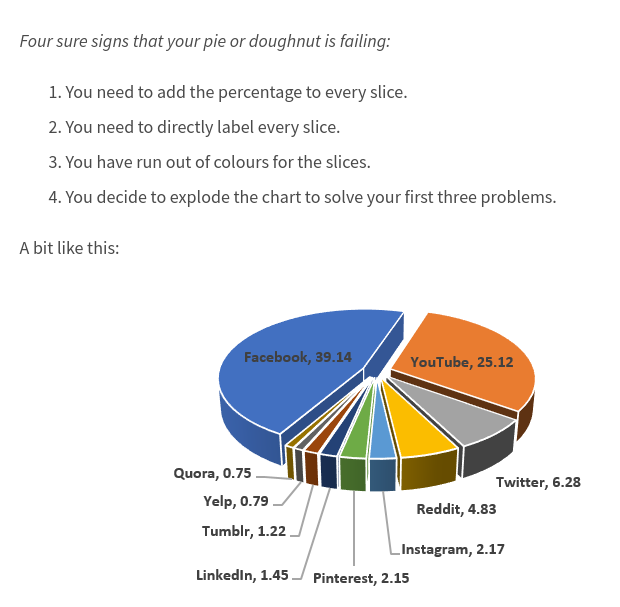
Pies and doughnuts fail because:
- Quantity is represented by slices; humans aren’t particularly good at estimating quantity from angles, which is the skill needed.
- Matching the labels and the slices can be hard work.
- Small percentages (which might be important) are tricky to show.

The world is interesting.
Nel mezzo del deserto posso dire tutto quello che voglio.
comments powered by Disqus