Seaborn matplotlib labeling data points
Trivial option: Label data points with Seaborn & Matplotlib | EasyTweaks.com
TL;DR
for i, label in enumerate (data_labels):
    ax.annotate(label, (x_position, y_position))
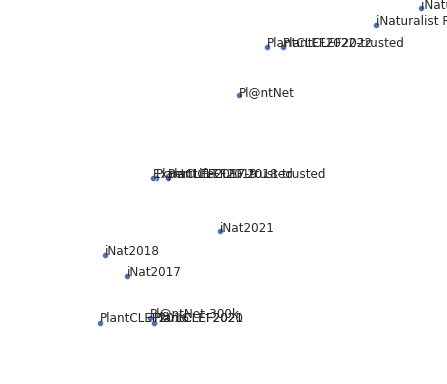
BUT! Overlapping texts are sad:

SO sent me to the library Home · Phlya/adjustText Wiki and it’s awesome
fig, ax = plt.subplots()
plt.plot(x, y, 'bo')
texts = [plt.text(x[i], y[i], 'Text%s' %i, ha='center', va='center') for i in range(len(x))]
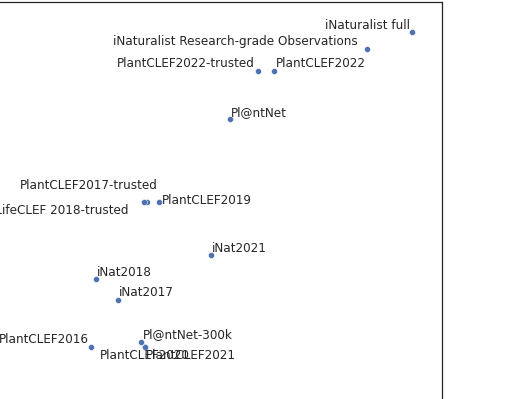
# adjust_text(texts)
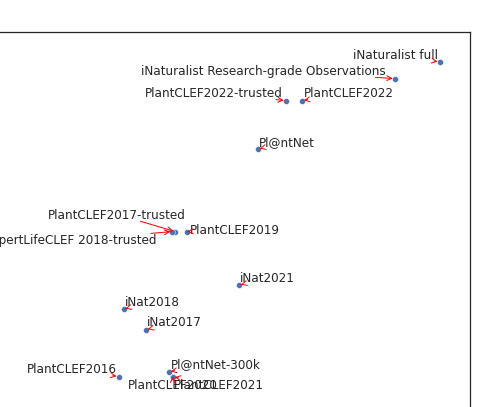
adjust_text(texts, arrowprops=dict(arrowstyle='->', color='red'))
Not perfect but MUCH cleaner:


More advanced tutorial: adjustText/Examples.ipynb at master · Phlya/adjustText · GitHub
Pypy doesn’t have the latest version, which has:
min_arrow_len- some other bits like
expand - more: adjustText/init.py at master · Phlya/adjustText · GitHub
Nel mezzo del deserto posso dire tutto quello che voglio.
comments powered by Disqus