Adventures in plotting things on maps
So I have recorded a lot of random tracks of my location through the OSMAnd Android app and I wanted to see if I can visualize them. This was a deep dive into the whole topic of visualizing geo data.
Likely I got some things wrong but I think I have a picture more or less of what exists, and I tried to use a lot of it.
Basics
Formats
GPX
OSMAnd gives me .gpx files.
(I specifically would like to mention OsmAnd GPX | OsmAnd, that I should have opened MUCH earlier, and that would have saved me one hour trying to understand why do the speeds look strange: they were in meters per second.)
A GPX file give you a set(?) of tracks composed of segments that are a list of points, with some additional optional attributes/data with them.
GeoJSON
Saw it mentioned the most often, therefore in my head it’s an important format.
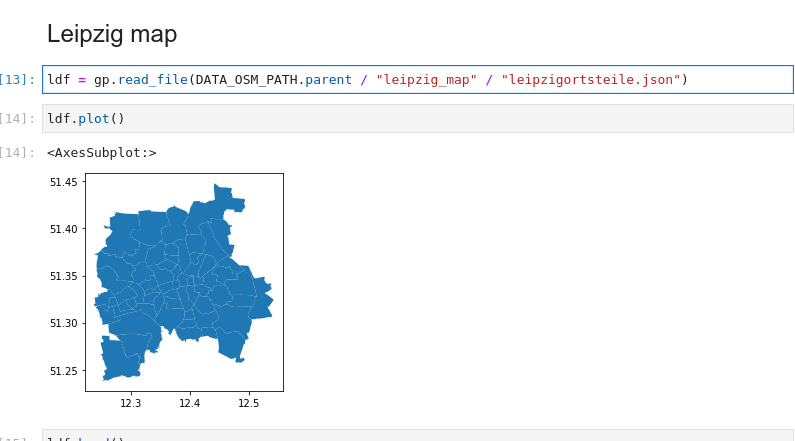
Among other things, it’s one of the formats Stadt Leipzig provides data about the different parts of the city in, and I used that data heavily: Geodaten der Leipziger Ortsteile und Stadtbezirke - Geodaten der Leipziger Ortsteile - Open Data-Portal der Stadt Leipzig
Less important formats
Are out of scope of this and I never used them, but if I had to look somewhere for a list it’d be here: Input/output — GeoPandas 0.13.0+0.gaa5abc3.dirty documentation
Getting data
- Export | OpenStreetMap is awesome, and I used it really often to get GPS coordinates of places when I needed it.
- Random gov’t websites provide geospatial data surprisingly often! Including the already mentioned city of Leipzig.
- Some maps can be downloaded automagically from python code just by providing not even coordinates, but a plain text location like an address! Below there will be examples but Guide to the Place API — contextily 1.1.0 documentation made me go “wow that’s so cool!” immediately
- A lot of apps can record GPX tracks, it seems to be the de-facto standard format for that (be it for hiking / paragliding / whatever)
Libraries
gpgpy for reading GPX files
Really lightweight and is basically an interface to the XML content of such files.
import gpxpy

# Assume gpx_tracks is a list of Paths to .gpx files
data = list()
for f in tqdm.tqdm(gpx_tracks):
    gpx_data = gpxpy.parse(f.read_text())
	# For each track inside that file
    for t in gpx_data.tracks:
		# For each segment of that track
        for s in t.segments:
			# We create a row
            el = {"file": f.name, "segment": s}
            data.append(el)

# Vanilla pd.DataFrame with those data
df = pd.DataFrame(data)

# We add more info about each segment
df["time_start"] = df["track"].map(lambda x: x.get_time_bounds().start_time)
df["time_end"] = df["track"].map(lambda x: x.get_time_bounds().end_time)
df["duration"] = df["track"].map(lambda x: x.get_duration())
df
At the end of my notebook, I used a more complex function to do the same basically:
WITH_OBJ = False
LIM=30
data = list()
# Ugly way to enumerate files
fn = -1
for f in tqdm.tqdm(gpx_tracks[:LIM]):
fn += 1
gpx_data = gpxpy.parse(f.read_text())
for tn, t in enumerate(gpx_data.tracks):
for sn, s in enumerate(t.segments):
# Same as above, but with one row per point now:
for pn, p in enumerate(s.points):
# We get the speed at each point
point_speed = s.get_speed(pn)
if point_speed:
# Multiply to get m/s -> km/h
point_speed *= 3.6
el = {
"file": f.name,
"file_n": fn,
"track_n": tn,
"seg_n": sn,
"point_n": pn,
"p_speed": point_speed,
"p_lat": p.latitude,
"p_lon": p.longitude,
"p_height": p.elevation,
}
# If needed, add the individual objects too
if WITH_OBJ:
el.update(
{
"track": t,
"segm": s,
"point": p,
}
)
data.append(el)
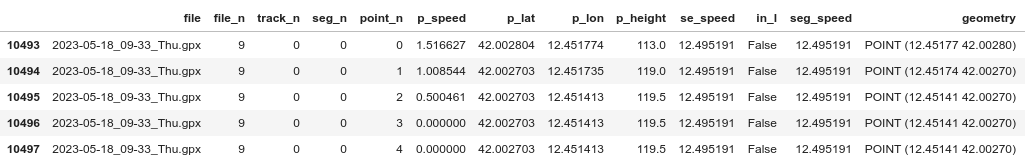
ft = pd.DataFrame(data)
gft = gp.GeoDataFrame(ft, geometry=gp.points_from_xy(ft.p_lon, ft.p_lat))
Then you can do groupbys etc by file/track/segment/… and do things like mean segment speed:
gft.groupby(["file_n", "track_n", "seg_n"]).p_speed.transform("mean")
gft["seg_speed"] = gft.groupby(["file_n", "track_n", "seg_n"]).p_speed.transform("mean")
GeoPandas
GeoPandas 0.13.0 — GeoPandas 0.13.0+0.gaa5abc3.dirty documentation
It’s a superset of pandas but with more cool additional functionality built on top. Didn’t find it intuitive at all, but again new topic to me and all that.
Here’s an example of creating a GeoDataFrame:
import geopandas as gp

# Assume df_points.lon is a pd.Series/list-like of longitudes etc.
pdf = gp.GeoDataFrame(
    df_points, geometry=gp.points_from_xy(df_points.lon, df_points.lat)
)

# we have a GeoDataFrame that's valid, because we created a `geometry` that gets semantically parsed as geo-data now!
Theoretically you can also read .gpx files directly, adapted from GPS track (GPX-Datei) in Geopandas öffnen | Florian Neukirchen to use pd.concat:
gdft = gp.GeoDataFrame(columns=["name", "geometry"], geometry="geometry")

for file in gpx_tracks:
    try:
        f_gdf = gp.read_file(file, layer="tracks")
        gdft = pd.concat([gdft, f_gdf"name", "geometry"])
    except Exception as e:
        pass
        # print("Error", file, e)
Problem with that is that I got a GeoDataFrame with shapely.MultiLineStrings that I could plot, but not
easily do more interesting stuff with it directly:
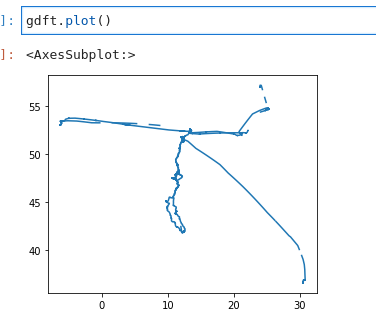
Under the hood, GeoPandas uses Shapely a lot. I love shapely, but I gave up on directly reading GPX files with geopandas", and went with the gpgpy way described above.
Spatial Joins
Merging data — GeoPandas 0.13.0+0.gaa5abc3.dirty documentation, first found on python - Accelerating GeoPandas for selecting points inside polygon - Geographic Information Systems Stack Exchange
Are really cool, and you can merge two different geodataframes based on whether things are inside/intersecting/outside other things, with the vanilla join analogy holding well otherwise.
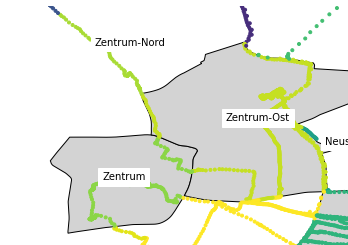
FOR EXAMPLE, we have the data about Leipzig ldf from before:
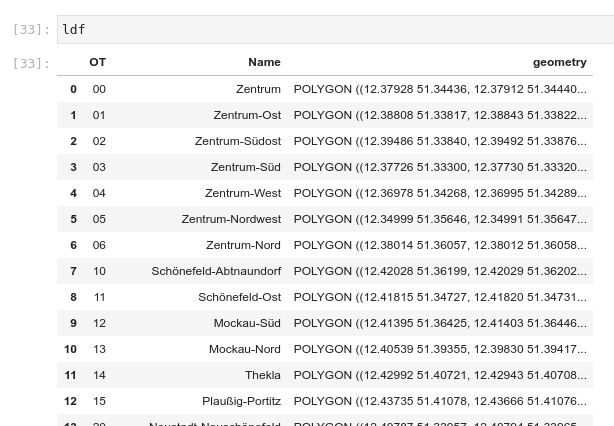
We can
pdf = pdf.sjoin(ldf, how="left", predicate="intersects")
it with our pdf dataframe with points, it automatically takes the geometry from both, finds the points that are inside different parts of Leipzig, and you get your points with the columns from the part of Leipzig they’re located at!
Then you can do pretty graphs with the points colored based on that, etc.:
TODO
Adding a background map to plots — GeoPandas 0.13.0+0.gaa5abc3.dirty documentation contextily/intro_guide.ipynb at main · geopandas/contextily · GitHub DenisCarriere/geocoder: Python Geocoder API Overview — geocoder 1.38.1 documentation Sampling Points — GeoPandas 0.13.0+0.gaa5abc3.dirty documentation
Guide to the Place API — contextily 1.1.0 documentation Quickstart — Folium 0.14.0 documentation A short look into providers objects — contextily 1.1.0 documentation plugins — Folium 0.14.0 documentation masajid390/BeautifyMarker Plotting with Folium — GeoPandas 0.13.0+0.gaa5abc3.dirty documentation
- Folium exporting map as html through
html_code = m.get_root()._repr_html_()