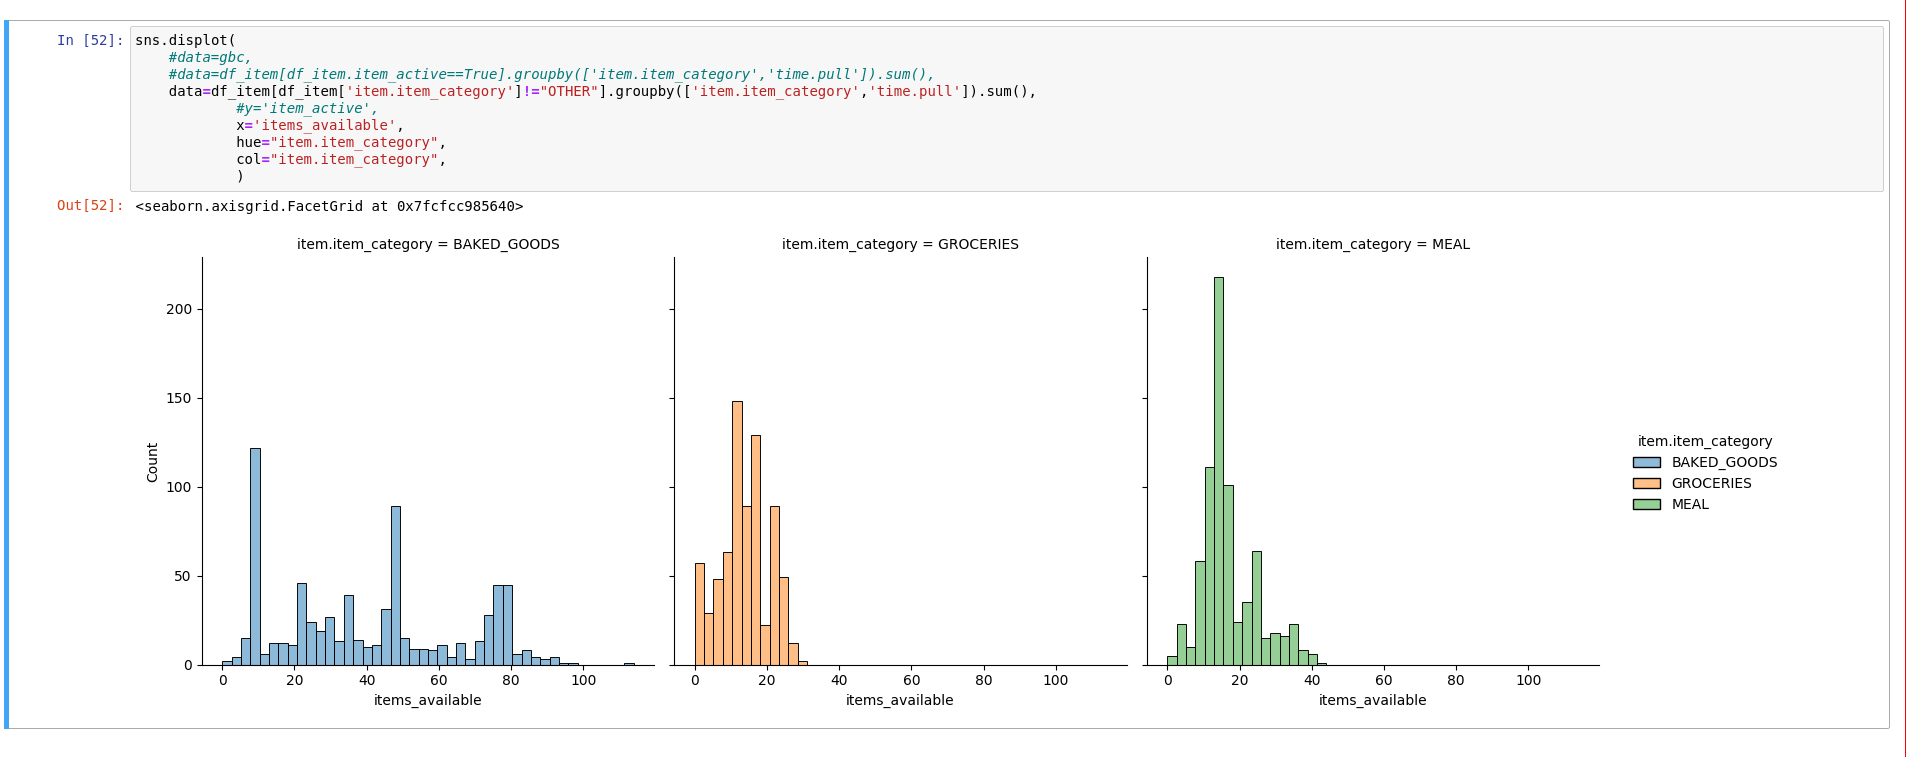
seaborn things built on FacetGrid for easy multiple plots
This is REALLY neat and seaborn is now officially the best thing since sliced bread (only having pie charts could make it better1).
seaborn.FacetGrid — seaborn 0.12.2 documentation:
relplot Combine a relational plot and a FacetGrid
displot Combine a distribution plot and a FacetGrid
catplot Combine a categorical plot and a FacetGrid
lmplot Combine a regression plot and a FacetGrid

sns.displot(
	data=df_item[df_item['item.item_category']!="OTHER"].groupby(['item.item_category','time.pull']).sum(),
	#y='item_active',
	x='items_available',
	hue="item.item_category",
	col="item.item_category",
)
All of this takes row/col arguments that neatly create separate plots!
-
Obyde/obsidian internal link test: 230515-1855 Pie charts considered harmful ↩︎
Nel mezzo del deserto posso dire tutto quello che voglio.
comments powered by Disqus