serhii.net
In the middle of the desert you can say anything you want
-
Day 1791 (26 Nov 2023)
Krita awesomeness
Wanted to do coloring and remembered about Krita and the tutorial about flat coloring (Flat Coloring — Krita Manual 5.2.0 documentation) mentioned the Colorize Mask and it’s awesome!
Needed to actually understand it, and even had to watch a video tutorial (Tutorial: Coloring with “Colorize-mask” in Krita - YouTube) but it was so worth it!
It’s basically a bucket fill tool on steroids, and even might be reason enough to move away from Inkscape for some of these tasks!
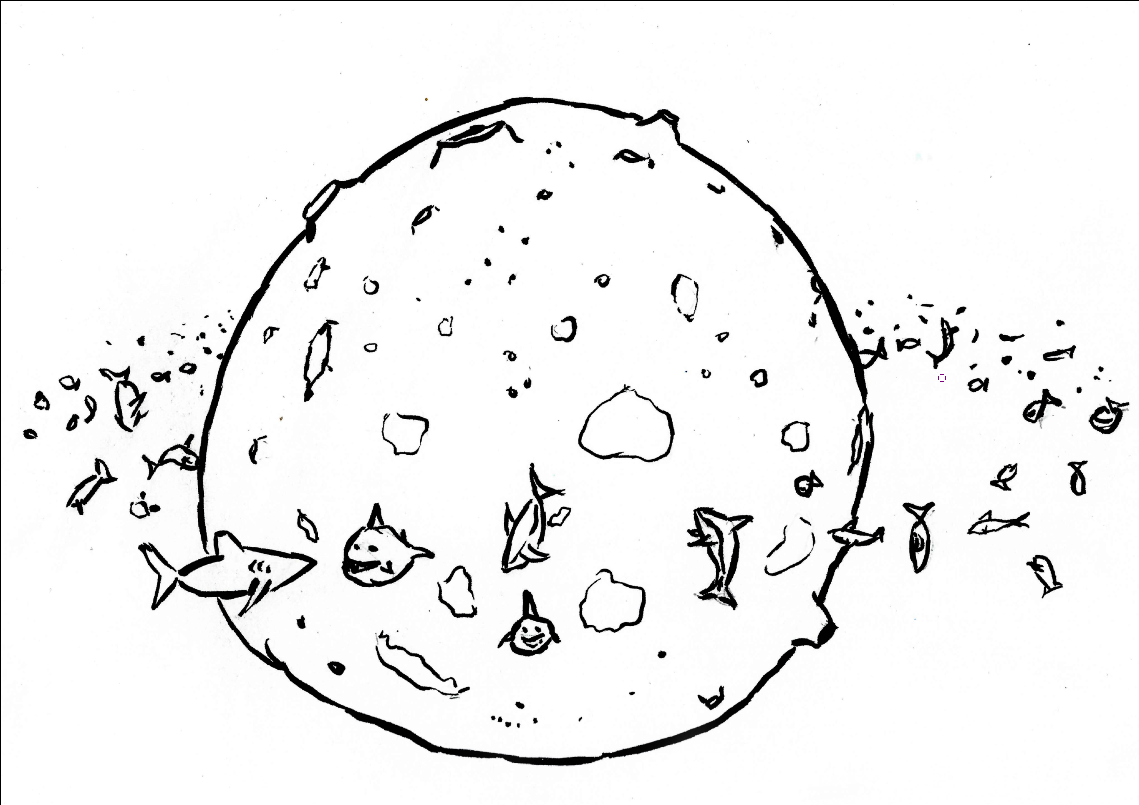
Cleaned lineart:
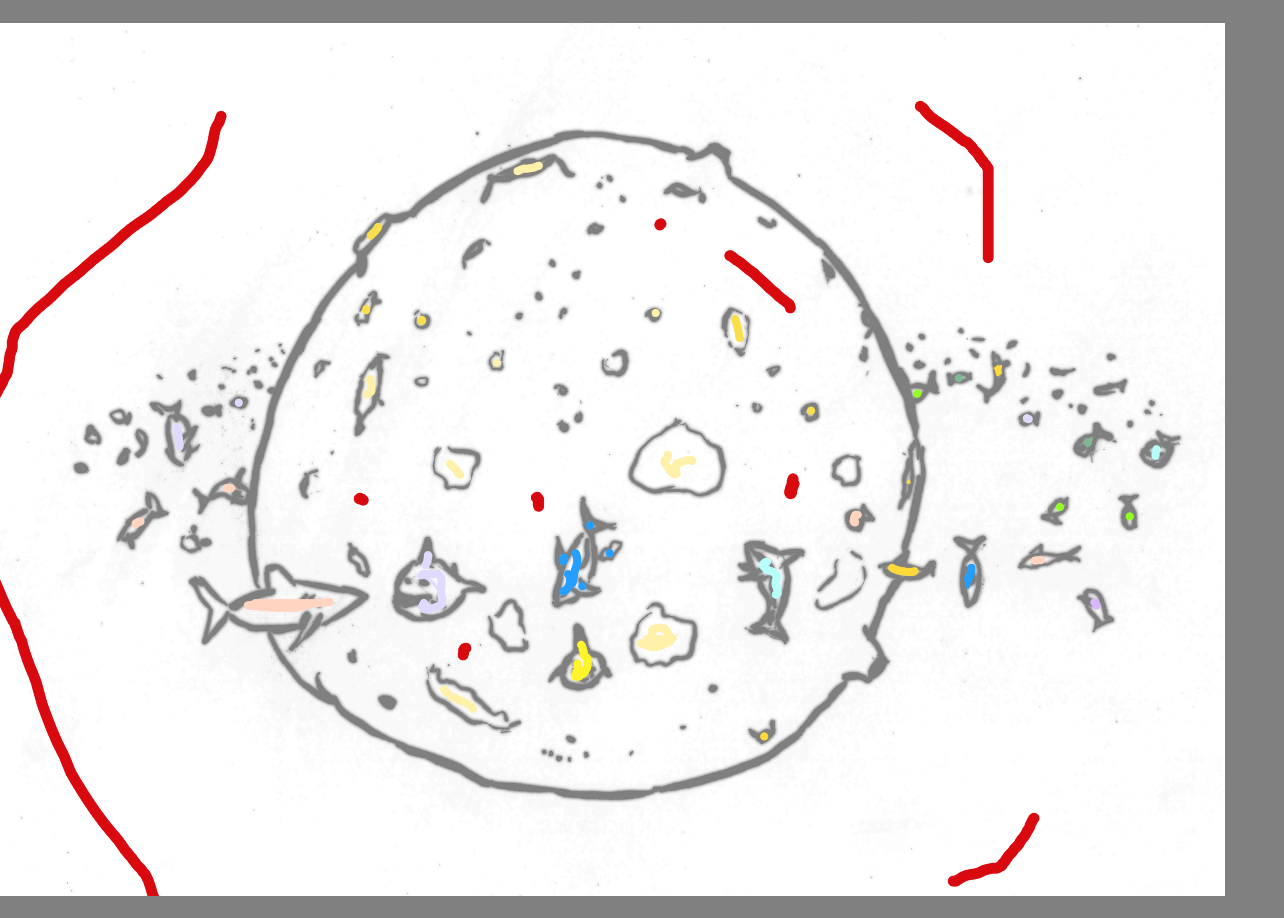
Mask (red is transparent):
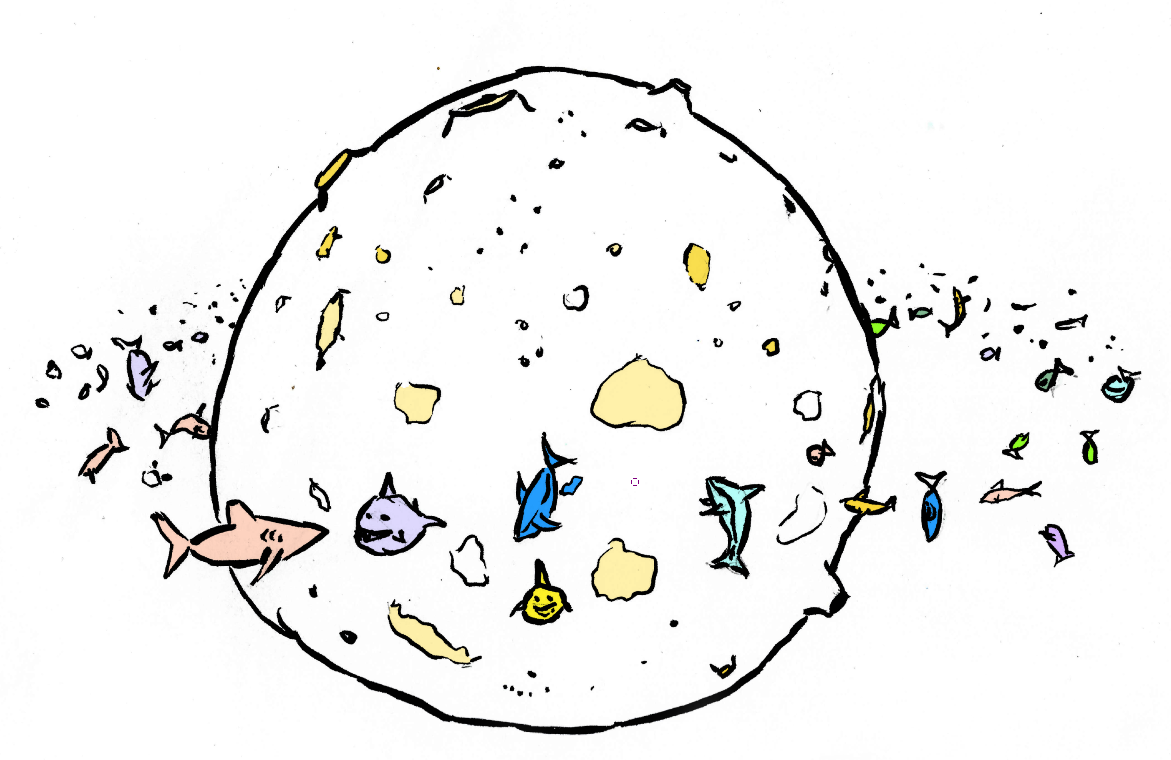
Result:
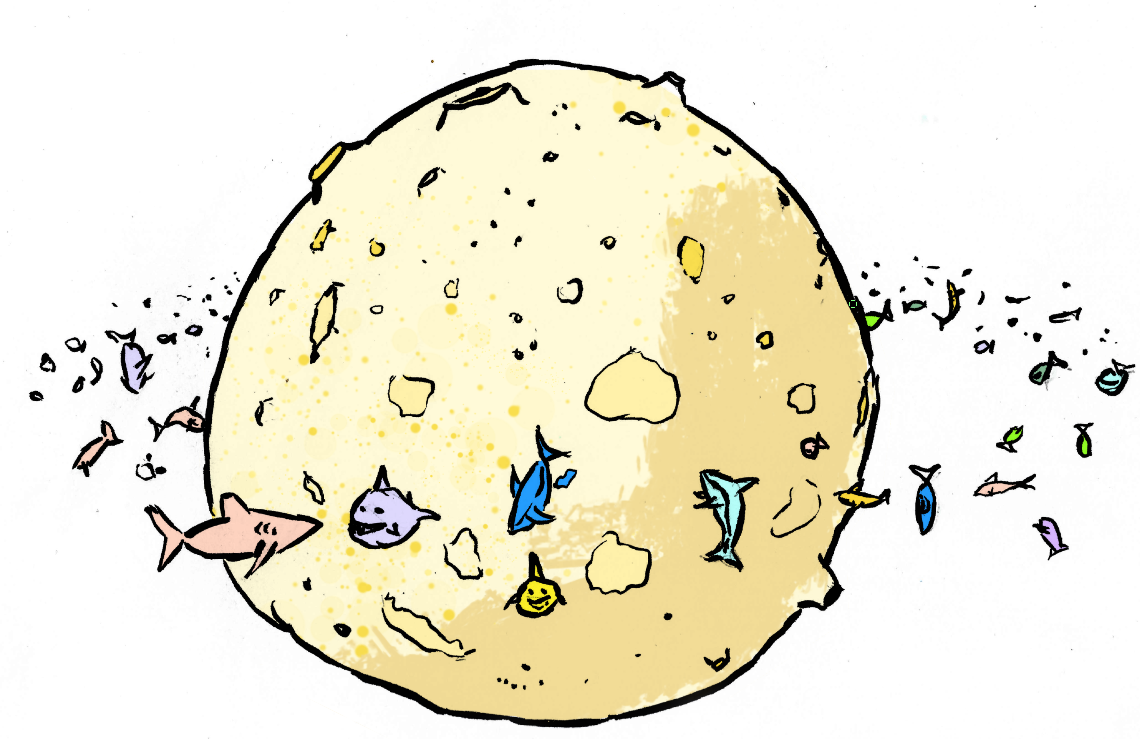
Result with random brushes moon texture below it:
Interesting bits:
- any unfilled areas will be filled, that is - if there’s an area that should be left alone it has to be explicitly marked as transparent or any color. This was the most confusing to me at first
- The colorize mask layer should be
Multiply, but if there’s anything else below it it’ll be a mess - sometimes it should just be converted to a paint layer w/ the correct settings to see what it will look like in the end - if you want to remove all instances of a specific color and use color select by color tool for that - it WILL be a mess because borders, and the color mask tool has already a button to remove a color, USE IT.
-
Day 1782 (17 Nov 2023)
'Roter Faden'
Heard the expression “roter Faden”, googled it, and it’s actually interesting and relevant.
In a scientific context, it’s the main topic / leitmotiv / … of the text. You ask a question, and all parts of the text should work together to answer it, relating to it in a clear way.
Excellent (PDF) link on this exact topic in scientific writing & an itemized list of ways to make it clear: https://www.uni-osnabrueck.de/fileadmin/documents/public/1_universitaet/1.3_organisation/sprachenzentrum/schreibwerkstatt/Roter_Faden_Endversion.pdf
TODO hypothetically save it from link rot somewhere
Also:
- untermauern: underpin
- durch ein Grafik XXX_(Akk.)_ untermauern
- untermauern: underpin
-
Day 1781 (16 Nov 2023)
python progressbar2
wolph/python-progressbar: Progressbar 2 - A progress bar for Python 2 and Python 3 - “pip install progressbar2” really cool flexible progressbar.
Also: progressbar.widgets — Progress Bar 4.3b.0 documentation:
Examples of markers:
	 - Smooth: ` ▏▎▍▌▋▊▉█` (default)
	 - Bar: ` ▁▂▃▄▅▆▇█`
	 - Snake: ` ▖▌▛█`
	 - Fade in: ` ░▒▓█`
	 - Dots: ` ⡀⡄⡆⡇⣇⣧⣷⣿`
	 - Growing circles: ` .oO`
Export all papers of an author from Google Scholar to BibTex
You can export your own papers as single file and the entire Internet tells you how. But if you’re NOT the author, this is a workaround I found:
- Add the papers to your library
- Export them all from your library!
-
Day 1774 (09 Nov 2023)
llm python module for CLI llm or chatGPT use
Github: simonw/llm: Access large language models from the command-line
The example from the tweet:
git log | head -n 200 | llm -s "Of the most recent 5 commits, which is probably the most important? I use 'Minor' and similar commit messages to mark unimportant commits."llmon pypy
Sad clown paradox
I’ll restart https://serhii.net/links later, and this will be the first bit I’ll add there:
TL;DR comedians are associated with depression/anxiety:
Humour has been shown to develop from a young age, fostered by parental behaviour. A parent’s immature nature can lead to additional responsibilities forced onto children, which can evoke issues of self-worth and a need for acceptance. The constant search for approval may cause mental health issues such as anxiety or depression […] Laughter can evolve as a medium for self-preservation, detaching the individual from any adversity faced allowing for perceived control over uncomfortable situations.
Sad clown paradox is characterised by a cyclothymic temperament, which encourages the creation of light-hearted humour in a professional setting, despite inner turmoil.
-
Day 1767 (02 Nov 2023)
ChatGPT is awesome to generate dummy data!
So, this: https://chat.openai.com/share/764434d6-ceba-4b9d-8cfc-7899f73f9cd3
You can enter a dummy markdown file or whatever and ask it to generate some other similar files! Like lorem ipsum but way way cooler and more open to nuance
Wowchemy basics
TIL wowchemy exists, and wowchemy/starter-hugo-research-group: 👥 轻松创建研究组或组织网站 Easily create a stunning Research Group, Team, or Business Website with no-code is one template there that I’ll use to start learning about it.
This will be much messier than the average post in the Diensttagebuch
Their documentation seems to be undergoing some overhaul and half of the links don’t work and half don’t open in qutebrowser, will do what I can
Idea
The main idea seems to be that blocks can live in different
.mdfiles in a folder, and are shown in the page based on their “weight” argument.Blocks
Page collection
Wowchemy has different block types, one is Page Collection | Wowchemy for a collection of pages. A la page list in vanilla Hugo.
Actually there’s 🧱 Build your pages with blocks: no-code required! | Wowchemy Docs that’s closer to that
Page features
https://university.wowchemy.com/reference/page-features/
More bits
type: widget_pagemeans it’ll parse the pages AND DIRECTORIES inside the dir it’s located in as widgets, example of this is the home page.
I see no way to include two different lists of pages inside the directory without having all these pages also appear as widgets - in other words, how to “include” pages in that subfolder from some of the widgets but not the widgets page itself.
But - now I see why the home page is inside
./content/home…
-
Day 1757 (24 Oct 2023)
Master thesis task CBT
Basics
- Children’s book test [^@taskCBT]
- Will use label-studio for any annotations if needed later on
- Sources for UA text:
- казки - Search - Anna’s Archive
- For now will use the text of Казки добрих сусідів. Золотоголова рибка: Вірменські народні казки - Anna’s Archive to write the code, will later find a good-OCR version of some book from the 1980s or sth likely to be out of copyright
- DE: library.lol/fiction/44e759bb147893cd46bf3549894f3706
- казки - Search - Anna’s Archive
- For putting other words in the correct morphology, Руководство пользователя — Морфологический анализатор pymorphy2 seems nice!
TODOs
- deduplicate options etc. by lemma (синку-син-??)
- gender of the noun giving hints!
- the bits below
Issues/Problems/TODOs
Multiple possible answers
— Синку, як ти мене знайшов? — запитав батько. — Коли вже так, віднеси обід до джерела, я туди прийду і поїмо
QUESTION:	— Ні, батьку, — сказав ______ .
OPTIONS:	{'хлопець', 'хлопчик', 'син', 'цар'}
Complex structures
Будь ______ , пообідайте з нами!', options={'ласка', 'ножа', 'жаль', 'візир', 'дозволь'}, answer='ласка')Unknown/unknowable answer
│ context = 'Ein Mann und eine Frau hatten einen goldenen Ring. Das war ein     │
│           Glücksring, und wer ihn besaß, hatte immer genug zu leben. Sie      │
│           wußten es aber nicht und verkauften den Ring für wenig Geld. Kaum   │
│           war der Ring aus dem Hause, da wurden sie immer ärmer und wußten    │
│           schließlich nicht mehr, woher sie genug zum Essen nehmen sollten.   │
│           Sie hatten auch einen Hund und eine Katze, die mußten mit ihnen     │
│           Hunger leiden. Da ratschlagten die Tiere miteinander, wie sie den   │
│           Leuten wieder zu ihrem alten Glück verhelfen könnten.'              │
I'll be using "Label all tasks"  then it would show me the next CBT after I submit.

Keybindings are nice for classifying text.

When importing  the things, I should try to do text highlighting or whatever to make it easier visually.
Code notes
Multiple hard options
Sometimes it gives multiple options
[
    Parse(
        word='корів',
        tag=OpencorporaTag('NOUN,inan plur,gent'),
        normal_form='кір',
        score=1.0,
        methods_stack=((DictionaryAnalyzer(), 'корів', 498, 11),)
    ),
    Parse(
        word='корів',
        tag=OpencorporaTag('NOUN,anim plur,gent'),
        normal_form='корова',
        score=1.0,
        methods_stack=((DictionaryAnalyzer(), 'корів', 2063, 8),)
    ),
    Parse(
        word='корів',
        tag=OpencorporaTag('NOUN,anim plur,accs'),
        normal_form='корова',
        score=1.0,
        methods_stack=((DictionaryAnalyzer(), 'корів', 2063, 10),)
    )
]
I can find the right one:
-
by morphology gotten from spacy?
-
by base form gotten from spacy?
token.lemma_
-
there’s no score for UA language in pymorphy, but they have an article on how to do this in general: Руководство пользователя — Морфологический анализатор pymorphy2
- I think my use of spacy might be relatively novel there, haha
-
If I have to get an intermediate representation:
- pymorphy’s OpenCorporaTags is part of OpenCorpora: открытый корпус русского языка, which is a Russian corpus project
- OpenCorpora: открытый корпус русского языка
- OpenCorpora/russian-tagsets: Russian morphological tagset converters library. is a library for converting stuff!
- And Universal Dependencies seems a neutral one?..
- spacy uses FEATS which is basically Universal Dependencies: https://spacy.io/api/morphology#morphanalysis links to CoNLL-U Format,
- Universal features so cool
- Spacy’s FEATS <-> dict etc. code: spaCy/spacy/morphology.pyx at master · explosion/spaCy
- pymorphy’s OpenCorporaTags is part of OpenCorpora: открытый корпус русского языка, which is a Russian corpus project
-
lang-uk/ukrainian-heteronyms-dictionary: Dictionary of heteronyms in the Ukrainian language dictionary of cases where птАшки/пташкИ
2023-11-29 11:46
-
ChatGPT suggested using spacy for this which led to googling for other options:
- pyinflect · PyPI
- links to bjascob/LemmInflect: A python module for English lemmatization and inflection., allegedly a better one
- English-only
- I so should mention how many of the inflection libraries don’t follow the bender rule and I have to guess if they are English-only or not. pyinflect doesn’t
- tooleks/shevchenko-js: JavaScript library for declension of Ukrainian anthroponyms but only for proper names
- Nothing exists, ChatGPT lied multiple times
-
Ukrainian UD UD
- UD_Ukrainian-IU TODO
-
Jena Oct 2003 orga for UA NLP: About / UkrNLP-Corpora TODO ADD
-
pymorphy2 code is quite interesting and I have much to learn from it! Decided then.
-
Writing the package
- TIL what spacy calls AUX for pymorphy it’s a VERB. The case is “був”. Interesting
- Finished
- Uploaded to pchr8/pymorphy-spacy-disambiguation: A package that picks the correct pymorphy2 morphology analysis based on morphology data from spacy, added to UA-CBT poetry dependencies!0
- I think I’ll be able to use this also for the фемінітиви task
-
Adding the newly created disambiguator to CBT-UA
- I save replacements as strings, without context - I need to save the spacy token to make use of it there too
2-3-4 and multiple plurals
- I can’t get pymorphy2 to inflect from singular to plural at all, which reminds me of the fact that it’s not just singular/plural
- Dual (grammatical number) - Wikipedia
make_agree_with_numberpymorphy2.analyzer — Морфологический анализатор pymorphy2 usesself.inflect(self.tag.numeral_agreement_grammemes(num))
(Pdb++) t.tag.numeral_agreement_grammemes(1) {'sing', 'nomn'} (Pdb++) t.tag.numeral_agreement_grammemes(2) {'sing', 'gent'} (Pdb++) t.tag.numeral_agreement_grammemes(3) {'sing', 'gent'} (Pdb++) t.tag.numeral_agreement_grammemes(4) {'sing', 'gent'} (Pdb++) t.tag.numeral_agreement_grammemes(5) {'plur', 'gent'} (Pdb++) t.tag.numeral_agreement_grammemes(6) {'plur', 'gent'}-
Узгодження власнекількісних простих числівників з іменниками — урок. Українська мова, 6 клас НУШ.
-
I have a suspicion that in Ukrainian it doesn’t parse singular as singular, and therefore can’t make agree with singular numbers. To plural and parsing words that are plural to begin with works fine!
(Pdb++) self.morph.parse("стіл")[1].inflect({'plur'}).tag.number
'plur'
(Pdb++) self.morph.parse("стіл")[1].tag.number
(Pdb++)
Yes:
(Pdb++) pp self.morph.parse("столи")[1].lexeme [Parse(word='стіл', tag=OpencorporaTag('NOUN,inan masc,nomn'), normal_form='стіл', score=1.0, methods_stack=((DictionaryAnalyzer(), 'стіл', 2710, 0),)), Parse(word='стола', tag=OpencorporaTag('NOUN,inan masc,gent'), normal_form='стіл', score=1.0, methods_stack=((DictionaryAnalyzer(), 'стола', 2710, 1),)), Parse(word='столу', tag=OpencorporaTag('NOUN,inan masc,gent'), normal_form='стіл', score=1.0, methods_stack=((DictionaryAnalyzer(), 'столу', 2710, 2),)), Parse(word='столові', tag=OpencorporaTag('NOUN,inan masc,datv'), normal_form='стіл', score=1.0, methods_stack=((DictionaryAnalyzer(), 'столові', 2710, 3),)), Parse(word='столу', tag=OpencorporaTag('NOUN,inan masc,datv'), normal_form='стіл', score=1.0, methods_stack=((DictionaryAnalyzer(), 'столу', 2710, 4),)), Parse(word='стіл', tag=OpencorporaTag('NOUN,inan masc,accs'), normal_form='стіл', score=1.0, methods_stack=((DictionaryAnalyzer(), 'стіл', 2710, 5),)), Parse(word='стола', tag=OpencorporaTag('NOUN,inan masc,accs'), normal_form='стіл', score=1.0, methods_stack=((DictionaryAnalyzer(), 'стола', 2710, 6),)), Parse(word='столом', tag=OpencorporaTag('NOUN,inan masc,ablt'), normal_form='стіл', score=1.0, methods_stack=((DictionaryAnalyzer(), 'столом', 2710, 7),)), Parse(word='столі', tag=OpencorporaTag('NOUN,inan masc,loct'), normal_form='стіл', score=1.0, methods_stack=((DictionaryAnalyzer(), 'столі', 2710, 8),)), Parse(word='столові', tag=OpencorporaTag('NOUN,inan masc,loct'), normal_form='стіл', score=1.0, methods_stack=((DictionaryAnalyzer(), 'столові', 2710, 9),)), Parse(word='столу', tag=OpencorporaTag('NOUN,inan masc,loct'), normal_form='стіл', score=1.0, methods_stack=((DictionaryAnalyzer(), 'столу', 2710, 10),)), Parse(word='столе', tag=OpencorporaTag('NOUN,inan masc,voct'), normal_form='стіл', score=1.0, methods_stack=((DictionaryAnalyzer(), 'столе', 2710, 11),)), Parse(word='столи', tag=OpencorporaTag('NOUN,inan plur,nomn'), normal_form='стіл', score=1.0, methods_stack=((DictionaryAnalyzer(), 'столи', 2710, 12),)), Parse(word='столів', tag=OpencorporaTag('NOUN,inan plur,gent'), normal_form='стіл', score=1.0, methods_stack=((DictionaryAnalyzer(), 'столів', 2710, 13),)), Parse(word='столам', tag=OpencorporaTag('NOUN,inan plur,datv'), normal_form='стіл', score=1.0, methods_stack=((DictionaryAnalyzer(), 'столам', 2710, 14),)), Parse(word='столи', tag=OpencorporaTag('NOUN,inan plur,accs'), normal_form='стіл', score=1.0, methods_stack=((DictionaryAnalyzer(), 'столи', 2710, 15),)), Parse(word='столами', tag=OpencorporaTag('NOUN,inan plur,ablt'), normal_form='стіл', score=1.0, methods_stack=((DictionaryAnalyzer(), 'столами', 2710, 16),)), Parse(word='столах', tag=OpencorporaTag('NOUN,inan plur,loct'), normal_form='стіл', score=1.0, methods_stack=((DictionaryAnalyzer(), 'столах', 2710, 17),)), Parse(word='столи', tag=OpencorporaTag('NOUN,inan plur,voct'), normal_form='стіл', score=1.0, methods_stack=((DictionaryAnalyzer(), 'столи', 2710, 18),))]-
Maybe it’s an artifact in conversion?
-
In either case I think I see the problem
chatGPT
..may help.
-
English: https://chat.openai.com/share/30ee2770-1195-4013-9d81-974278ac2a67
-
https://chat.openai.com/share/07250c3a-fcfc-4706-af82-74bbc497ee6f
-
Stories as graph networks
-
https://chat.openai.com/share/29f47a7d-8267-4b3b-bc55-3e1fe8e8baea+
Format
The LMentry example generated dataset is nice as example: lmentry/data/all_words_from_category.json at main · aviaefrat/lmentry Not all of it needs code and regexes! lmentry/data/bigger_number.json at main · aviaefrat/lmentry
More thoughts
Using GPT for filtering
-
I can ask gpt4 if it gets it, if it does - assume the individual instance is good enough
- Maybe just parse the entire generated dataset through the API for that!
- Approach: generate a lot of garbage, filter through gpt4 for the less garbage bits
- Maybe just parse the entire generated dataset through the API for that!
-
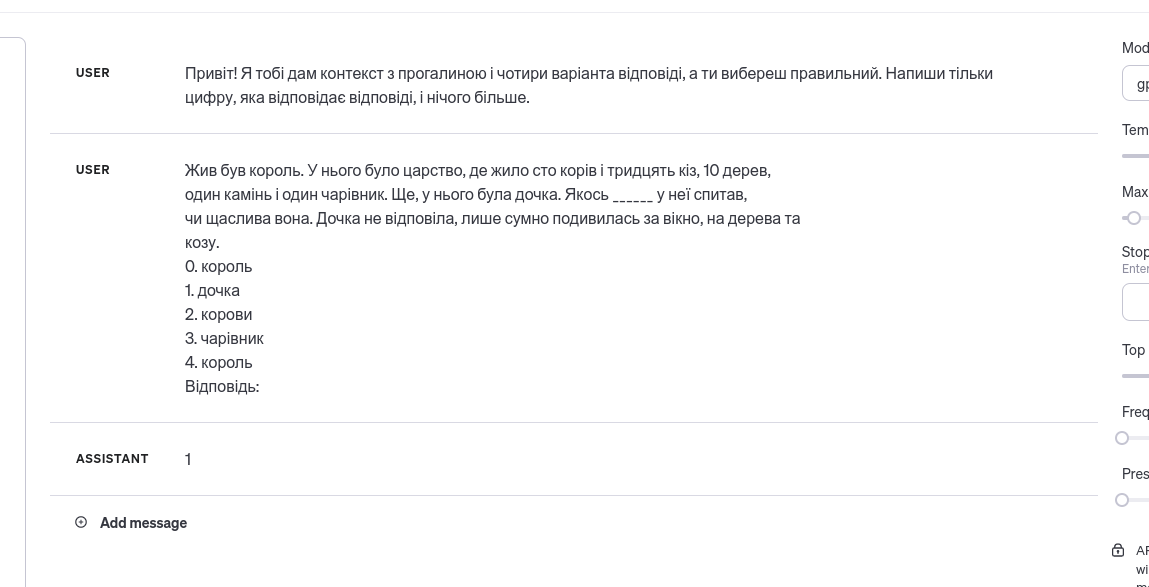
3.5-turbo can’t do this!
-
but gpt4 can!
playing more with the code
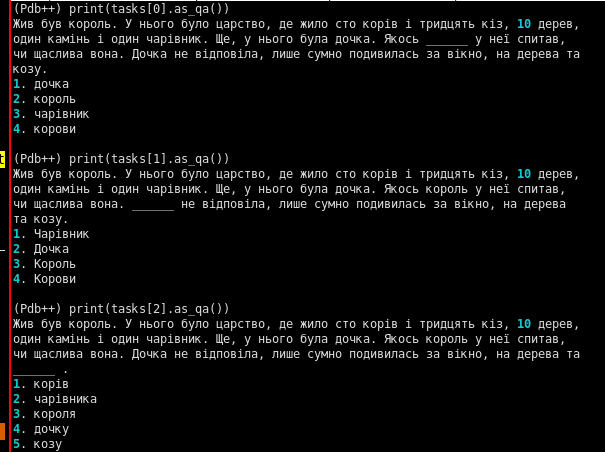
spacy’s largest model is not perfect either:
(Pdb++) doc[10:17]
жило сто корів і тридцять кіз,
(Pdb++) doc[15]
кіз
(Pdb++) doc[15].norm_
'кіз'
(Pdb++) doc[15].morph
Animacy=Inan|Case=Gen|Gender=Fem|Number=Plur
Вік живи вік учись… https://goroh.pp.ua/%D0%A2%D0%BB%D1%83%D0%BC%D0%B0%D1%87%D0%B5%D0%BD%D0%BD%D1%8F/%D0%BA%D1%96%D0%B7
Oh wait there’s also some kind of transformer model
python3 -m spacy download uk_core_news_trf:
https://spacy.io/models/uk#uk_core_news_trf, based on ukr-models/xlm-roberta-base-uk · Hugging Face. It doesn’t get it either 322 mbSolutions
- I can literally somehow hardcode that all animals are animals? Avoid using things like кіз?
- For pronouns and stuff I can do manual dictionary stuff, like її -> його etc.
// aside - this feels so satisfying to look at!
More generating stories with ChatGPT
GPT4 and graph structures
GPT4 is really good at writing stories based on graph-like descriptions which don’t use chunks found on Google and which aren’t continued in the same way by ChatGPT itself when I give it the first couple of sentences.
Even more complex ones with multiple characters: https://chat.openai.com/share/d42debd7-d80a-4030-ac7c-a18ecb1416a9
This is based on graph descriptions of stories generated by ChatGPT itself with the already mentioned prompt of ‘do easop but in graph form and not about grapes’.
231214-1503 Asking ChatGPT to make its own prompts is a superpower, now definitely:
“Generate an abstract graph structure for a narrative involving multiple animate characters. The graph should include nodes for entities, goals, challenges, interactions, outcomes, and moral lessons. Each node should abstractly represent the core elements of the story, focusing on thematic and moral aspects rather than the literal narrative. The format should be similar to a semantic web ontology, emphasizing relationships and abstract concepts. Please provide the graph in a Python dictionary format, with complexity and depth akin to an advanced semantic network.”
These will help me:
-
Aarne–Thompson–Uther Index - Wikipedia
- Tales of Magic 300 - 559 - ATU-AT-Motif - Library Guides at University of Missouri Libraries
- GPT4 is better at generating stories by index if the name of the index is provided, not just the number itself
-
https://chat.openai.com/share/147df026-9e4c-483f-b6b7-601debd1cdf1
I think I have gold. I either make it describe ATU stories as generic graphs and then make it generate stories matching these graphs, or make it generate graphs of existing stories w/ replacements and make it generate stories based on these changed (but still concrete) graphs.
Bonus points: find some parseable ATU index online and pick the ATU indexes that have no Ukrainian or Russian folktales associated with it.
- Parseable English list of all indexes: Animal Tales 1 - 299 - ATU-AT-Motif - Library Guides at University of Missouri Libraries
- This is an index of relevant stuff: Фольклор и постфольклор: структура, типология, семиотика
- This is quite close to what I need: https://www.ruthenia.ru/folklore/sus/index.htm
- This isn’t, but is insanely cool: TMI-search
- MFTD has few UKR translations, but many RUS ones — I can use them to filter known-bad ATU bits Copypasted https://www.ruthenia.ru/folklore/sus/indexleft.htm, then:
> ag ath | sed "s/.*: \(.*\)/\\1/g" > motivs_presentgave me the list of motifs with slavic tales.
I think this is the best prompt (https://chat.openai.com/share/32f40f4e-3973-42cf-8621-2eb8ebb94e76):
Generate an abstract graph structure for a narrative involving multiple animate characters. The graph should include nodes for entities, goals, challenges, interactions, outcomes, and moral lessons. Each node should abstractly represent the core elements of the story, focusing on thematic and moral aspects rather than the literal narrative. The format should be similar to a semantic web ontology, emphasizing relationships and abstract concepts. Please provide the graph in a Python dictionary format, with complexity and depth akin to an advanced semantic network. It should be less than 15 lines long.
The story is ATU motif 1: “the theft of fish”
Trivially editable to be about not-fish.
narrative_graph = {
    "Entities": {
        "Thief": {"Characteristics": ["Cunning", "Resourceful"], "Role": "Protagonist"},
        "Fish": {"Characteristics": ["Valuable", "Symbolic"], "Role": "Object"},
        "Owner": {"Characteristics": ["Victimized", "Unaware"], "Role": "Antagonist"}
    },
    "Goals": {
        "Thief": "Steal Fish",
        "Owner": "Protect Property"
    },
    "Challenges": {
        "Thief": "Avoid Detection",
        "Owner": "Secure Property"
    },
    "Interactions": {
        ("Thief", "Fish"): "Theft",
        ("Thief", "Owner"): "Avoidance",
        ("Owner", "Fish"): "Ownership"
    },
    "Outcomes": {
        "Immediate": "Successful Theft",
        "Long-term": "Loss of Trust"
    },
    "Moral Lessons": {
        "Actions Have Consequences",
        "Importance of Trust",
        "Greed Leads to Loss"
    }
}
Yes, this is the solution. Wooho! I’ll prolly manually pick some good ATUs and craft the different JSONs descriptions from which multiple stories will be generated.
Also, gpt3.5 creates faster and very comparable quality graphs than gpt4. This is 3.5:
{
    "Entities": [
        {
            "Name": "Thief",
            "Type": "Character"
        },
        {
            "Name": "Fisherman",
            "Type": "Character"
        },
        {
            "Name": "Fish",
            "Type": "Object"
        }
    ],
    "Goals": [
        {
            "Entity": "Thief",
            "Goal": "Steal Fish"
        },
        {
            "Entity": "Fisherman",
            "Goal": "Protect Fish"
        }
    ],
    "Challenges": [
        {
            "Challenge": "Conceal Theft",
            "Entity": "Thief"
        },
        {
            "Challenge": "Catch Thief",
            "Entity": "Fisherman"
        }
    ],
    "Interactions": [
        {
            "Interaction": "Theft",
            "Entities": ["Thief", "Fisherman"]
        }
    ],
    "Outcomes": [
        {
            "Outcome": "Thief Caught",
            "Entities": ["Thief"]
        },
        {
            "Outcome": "Fish Returned",
            "Entities": ["Fisherman"]
        }
    ],
    "MoralLessons": [
        {
            "Lesson": "Stealing leads to consequences",
            "Entities": ["Thief"]
        },
        {
            "Lesson": "Protecting what's yours is important",
            "Entities": ["Fisherman"]
        }
    ]
}
2023-12-15 15:15 231010-1003 Masterarbeit Tagebuch
231010-1003 Masterarbeit Tagebuch#231024-1704 Master thesis task CBT Results of discussion: - general idea about label-studio to filter bad ones is solid - -> what are the chances that a LM gets the answer right randomly? - some examples are bad not because impossible, but because no context needed to narrow down solutions - e.g. in the example below, it’s clearly ‘vater’ or ‘mutter’ regardless of what the context says:
 - … leading to a probability not of 1/4(..10) but 1/2
- one way to filter out such bad examples is to get a LM to solve the task without providing context, or even better - look at the distribution of probabilities over the answers and see if some are MUCH more likely than the others
- Issue with 2-3-4 plurals: I can just create three classes of nouns, singular, 2-3-4, and >=5
- don’t forget to discuss the morphology complexities in the masterarbeit
- Conveying the issues in English is hard, but I can (for a given UA example)
- provide the morphology info for the English words
- provide a third German translation
- … leading to a probability not of 1/4(..10) but 1/2
- one way to filter out such bad examples is to get a LM to solve the task without providing context, or even better - look at the distribution of probabilities over the answers and see if some are MUCH more likely than the others
- Issue with 2-3-4 plurals: I can just create three classes of nouns, singular, 2-3-4, and >=5
- don’t forget to discuss the morphology complexities in the masterarbeit
- Conveying the issues in English is hard, but I can (for a given UA example)
- provide the morphology info for the English words
- provide a third German translation-
What if iI use the same approach I did in LMentry, with capitalizing the words I feel are worth replacing and then doing regex/templating magic?
- I’d use the same story, highlight the needed words by double clicking, and get around ~10 replacements from each story, and have to do 100 of them for it to start making sense…
-
I should refactor the code that given a specific word and options replaces the word with a blank and puts the options in the correct morphology, that way I will be able to use it as a more generic thing.
Other options for annotation
- Hamel’s Blog - Tools for curating LLM data linked to
- Prodigy · Prodigy · An annotation tool for AI, Machine Learning & NLP
- see if it works ok on mobile! looks very easy
- Shiny Gallery
- Prodigy · Prodigy · An annotation tool for AI, Machine Learning & NLP
Alternatives
Similar tasks:
- NarrativeQA!
- Story clozze test
- CBeebes
- babl?..
In a certain sense, The Winograd Schema Challenge1 is trying to do basically the same thing as I am and describes many of the same pitfalls. WinoGrande2 is the same but larger and formulated as a fill-in-the-blanks thing and the paper contains info about how they used things like Roberta etc. to benchmark on it — input formats and all that.
Performance of existing models
"Одного разу селянин пішов у поле орати. Дружина зібрала йому обід. У селянина був семирічний син. Каже він матері: — Мамо, дай-но я віднесу обід батькові. — Синку, ти ще малий, не знайдеш батька, — відповіла мати. — Не бійтеся, матінко. Дорогу я знаю, обід віднесу. Мати врешті погодилась, зав’язала хліб у вузлик, приладнала йому на спину, вариво налила у миску, дала синові в ______ та й відправила у поле. Малий не заблукав, доніс обід батькові. — Синку, як ти мене знайшов? — запитав батько. — Коли вже так, віднеси обід до джерела, я туди прийду і поїмо. — Ні, батьку, — сказав син."
Замість _______ має бути:
"цар",
"рибки",
"хлопця",
"сина",
"руки"
?
On Perplexity Labs:
- mixtral8x7b-instruct is correct and logical
- codellama34b-instruct is correct
- pplx70b-chat fails
- llamab70b-chat fails
New idea
2024-01-11 12:58
- Find false friends by comparing word positions in RU and UA embeddings!
- Interference can be measured by higher sensitivity in RU native speaker UKR language VS other L1 native speakers
Back to pymorphy morphology
2024-02-07 20:55
Hopefully last problem of this type.
(Pdb++) x
Грізний
(Pdb++) x.morph
Animacy=Anim|Case=Gen|Gender=Masc|NameType=Sur|Number=Sing
(Pdb++) print(self.disamb.pymorphy_analyzer.parse(x.text))
[
    Parse(
        word='грізний',
        tag=OpencorporaTag('ADJF,compb masc,nomn'),
        normal_form='грізний',
        score=1.0,
        methods_stack=((DictionaryAnalyzer(), 'грізний', 76, 0),)
    ),
    Parse(
        word='грізний',
        tag=OpencorporaTag('ADJF,compb masc,accs'),
        normal_form='грізний',
        score=1.0,
        methods_stack=((DictionaryAnalyzer(), 'грізний', 76, 4),)
    ),
    Parse(
        word='грізний',
        tag=OpencorporaTag('ADJF,compb masc,voct'),
        normal_form='грізний',
        score=1.0,
        methods_stack=((DictionaryAnalyzer(), 'грізний', 76, 8),)
    )
]
This happens for only some of them e.g. Швидкий is sometimes OK:
(Pdb++) x
Швидкий
(Pdb++) x.morph
Animacy=Anim|Case=Nom|Gender=Masc|NameType=Sur|Number=Sing
(Pdb++) print(self.disamb.pymorphy_analyzer.parse(x.text))
[
    Parse(
        word='швидкий',
        tag=OpencorporaTag('ADJF,compb masc,nomn'),
        normal_form='швидкий',
        score=1.0,
        methods_stack=((DictionaryAnalyzer(), 'швидкий', 76, 0),)
    ),
    Parse(
        word='швидкий',
        tag=OpencorporaTag('ADJF,compb masc,accs'),
        normal_form='швидкий',
        score=1.0,
        methods_stack=((DictionaryAnalyzer(), 'швидкий', 76, 4),)
    ),
    Parse(
        word='швидкий',
        tag=OpencorporaTag('ADJF,compb masc,voct'),
        normal_form='швидкий',
        score=1.0,
        methods_stack=((DictionaryAnalyzer(), 'швидкий', 76, 8),)
    ),
    Parse(
        word='швидкий',
        tag=OpencorporaTag('NOUN,anim masc,nomn'),
        normal_form='швидкий',
        score=1.0,
        methods_stack=((DictionaryAnalyzer(), 'швидкий', 95, 0),)
    ),
    Parse(
        word='швидкий',
        tag=OpencorporaTag('NOUN,anim masc,voct'),
        normal_form='швидкий',
        score=1.0,
        methods_stack=((DictionaryAnalyzer(), 'швидкий', 95, 7),)
    )
]
(and then my get_with_disambiguation works)
What can I do?
- Throw stories away that use such names (and update the prompts)
- Find a way to cast it into a noun
- Do some hack based on this
- They are nouns-formed-from-adjectives, ergo they’ll prolly inflect like the adjectives themselves
- => Then I inflect adjectives!
I’ll try the last one.
['кравчиня', 'грізний', 'звір', 'швидкий', 'лев', 'грізного']Only one is strictly speaking a female noun, bad example.
['кравчиня']BUT I don’t want to inflect them by gender, because the lion Грізний != Грізна.
ALSO lemmas are a bundle of joy I forgot about.
(Pdb++) x1,x1.lemma_,x1.morph (Повільна, 'повільний', Case=Nom|Degree=Pos|Gender=Fem|Number=Sing) (Pdb++) x2,x2.lemma_,x2.morph (Грізного, 'грізного', Animacy=Anim|Case=Gen|Gender=Masc|NameType=Sur|Number=Sing)- What is degree for a noun?
- Degree
- Pos is first degree, like young man.
- ChatGPT says that it’s spacy recognizing the adjectival source of the noun and givin info about the original adjective.
- “Common in morphologically rich languages”
- Alright
(Pdb++) [v for k,v in lemmas.items()]
[жителі, власником, заєць, Швидкий, кравчиня, працівницею, левів, Грізний, Грізному, Грізного, звірів, конкуренти, лисиця, Хитра, вовк, Звірі,пліткам, Злий, конкурентки]
'Masc'], ['Masc'], ['Masc'], ['Masc'], ['Fem'], ['Fem'], ['Masc'], ['Masc'], ['Masc'], ['Masc'], ['Masc'], ['Masc'], ['Fem'], ['Fem'], ['Masc'], [], ['Masc'], ['Masc'], ['Fem'
Looking even deeper — spacy doesn’t get the more frequent names just as well. And counting the number of capitalized occurrences to build a dictionary etc. is not worth the effort. Giving up.
Also, how interesting:
(Pdb++) x
Шакал
(Pdb++) x.morph
Animacy=Anim|Case=Gen|Gender=Fem|NameType=Sur|Number=Sing|Uninflect=Yes
# lowercase version is interesting as well, inan ins?
Animacy=Inan|Case=Ins|Gender=Masc|Number=Sing
Also looking at “Лео” I realize that pymorphy3 is really much better. I sees it as a NOUN/Name, as opposed to UNKN. Is it too late?
Switched to pymorphy3, except two weird words incl. Жаба where there’s no case, I can see no difference. Left it so.
Hopefully last challenges
Дієприслівники GRND
What spacy sees as VERB pymorphy sees as GRND:
> cand відчувши > cand.morph Aspect=Perf|Tense=Past|VerbForm=Conv > cand.pos_ 'VERB' > self.disamb.get_with_disambiguation(cand).tag OpencorporaTag('GRND,perf')- UniversalDependencies VerbForm=Conv
- Деепричастие: Обозначения для граммем (русский язык) — Морфологический анализатор pymorphy2
-
<_(@winograd) “The winograd schema challenge” (2012) / Hector Levesque, Ernest Davis, Leora Morgenstern: z / / _> ↩︎
-
<_(@Sakaguchi2019) “WinoGrande: An Adversarial Winograd Schema Challenge at Scale” (2019) / Keisuke Sakaguchi, Ronan Le Bras, Chandra Bhagavatula, Yejin Choi: z / http://arxiv.org/abs/1907.10641 / _> ↩︎
Tqdm and logging
This redirects python logging to
tqdm.write()that plays better with tqdm progress bars:from tqdm.contrib.logging import logging_redirect_tqdm # .. with logging_redirect_tqdm(): pass