serhii.net
In the middle of the desert you can say anything you want
-
Day 2359 (17 Jun 2025)
Autorandr has neat short virtual configurations
autorandr -c vertical-reversedescribes my home layout,autorandr -c horizontaldescribes my work layout. Awesome.The following virtual configurations are available: off Disable all outputs common Clone all connected outputs at the largest common resolution clone-largest Clone all connected outputs with the largest resolution (sca- led down if necessary) horizontal Stack all connected outputs horizontally at their largest re- solution vertical Stack all connected outputs vertically at their largest reso- lution horizontal-reverse Stack all connected outputs horizontally at their largest re- solution in reverse order vertical-reverse Stack all connected outputs vertically at their largest reso- lution in reverse order
-
Day 2347 (05 Jun 2025)
Evaluation harnesses list and notes
Previously:
- more generic: 250317-1847 Current LLM evaluation landscape
- 250505-1019 Evaluating RAG
- 250415-1640 Evaluating NLG
EleutherAI lm-eval-harness
Link: EleutherAI/lm-evaluation-harness: A framework for few-shot evaluation of language models.
Running
Running HF model with model args (hf model name in
model_argsas well):lm_eval --model hf \ --model_args pretrained=EleutherAI/pythia-160m,revision=step100000,dtype="float" \ --tasks lambada_openai,hellaswag \ --device cuda:0 \ --batch_size 8Task formats
YAML+jinja, can run python code in some of the params.
task: coqa
dataset_path: EleutherAI/coqa
output_type: generate_until
training_split: train
validation_split: validation
doc_to_text: !function utils.doc_to_text
doc_to_target: !function utils.doc_to_target
process_results: !function utils.process_results
should_decontaminate: true
doc_to_decontamination_query: "{{story}} {{question.input_text|join('\n')}}"
generation_kwargs:
  until:
    - "\nQ:"
metric_list:
  - metric: em
    aggregation: mean
    higher_is_better: true
  - metric: f1
    aggregation: mean
    higher_is_better: true
Features
- Supports HF models/datasets
- Jinja templates, separate packages for IFeval, promptsource etc.
- Many options for post-processing, answer extraction, fewshot etc. the usual, all live in the YAML
Inference
- HF, incl. local, OpenAI API format, but other frameworks as well — nvidia nemo etc.
- Llama.cpp / vLLM
- multi-GPU with accelerate:
accelerate launch -m lm_eval --model ...
Saving and caching
- JSON through
--output_pathparam --log_sampleslogs samples--use-cachecaches stuff and reruns it only when needed--hf_hub_log_argslogs the results to HF ! (documentation broken though)
Misc
- Last (most complex) version of HF Hub leaderboard (before it got discontinued): lm-evaluation-harness/lm_eval/tasks/leaderboard/README.md at main · EleutherAI/lm-evaluation-harness
- Python integration:
simple_evaluate(): lm-evaluation-harness/docs/interface.md at main · EleutherAI/lm-evaluation-harness
lmms-eval
- EvolvingLMMs-Lab/lmms-eval: Accelerating the development of large multimodal models (LMMs) with one-click evaluation module - lmms-eval.
- very close in spirit to eval-harness but multimodal
Sample1:
export HF_HOME="~/.cache/huggingface"
export AZURE_OPENAI_API_KEY=""
export AZURE_OPENAI_API_BASE=""
export AZURE_OPENAI_API_VERSION="2023-07-01-preview"

# pip install git+https://github.com/EvolvingLMMs-Lab/lmms-eval.git
python3 -m lmms_eval \
    --model openai_compatible \
    --model_args model_version=gpt-4o-2024-11-20,azure_openai=True \
    --tasks mme,mmmu_val \
    --batch_size 1
Task yamls look very similar: lmms-eval/lmms_eval/tasks/gqa/gqa.yaml at main · EvolvingLMMs-Lab/lmms-eval
Evalverse
- Evalverse | Evalverse Docs
- Looks abandoned
- One package to run multiple eval frameworks:
- lm-eval for usual benchmarks
- Chat: evaluated using FastChat llm-as-a-judge
- MT-Bench
- IFEval
- EQ-Bench
- Their params:Evaluation | Evalverse Docs
- also “Common Arguments” (hah)
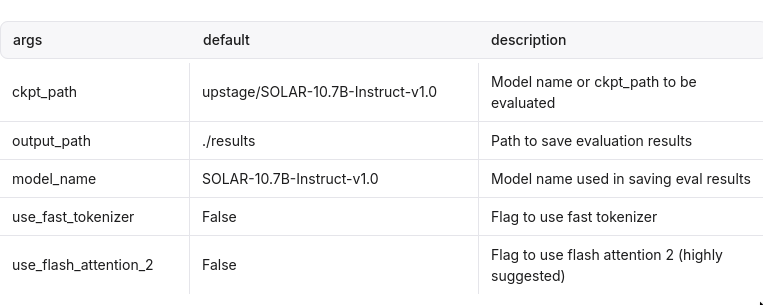
- And then arguments for each benchmark separately
- also “Common Arguments” (hah)
Architecture

Evaluator runs the library given by the Connector
Running
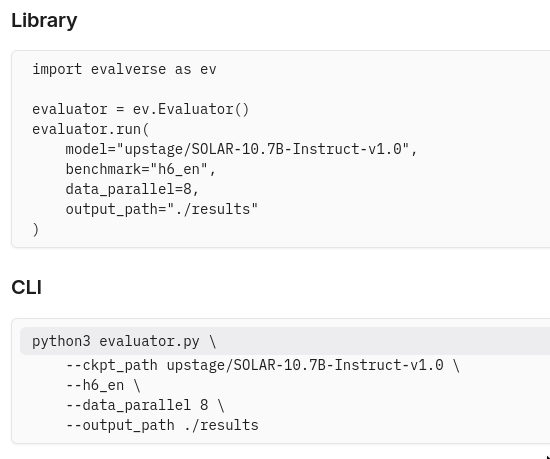 (h6_en is lm-eval)
Results
- JSON, one for each task.
- They have a Reporter class that summarizes and analyzes the results saved by the evaluator
OpenAI evals
- Link: openai/evals: Evals is a framework for evaluating LLMs and LLM systems, and an open-source registry of benchmarks.
- I like their documentation!
Running
oaieval gpt-3.5-turbo test-matchTask formats
Data
Data has to be in JSONL format.
{
  "input": [
    {
      "role": "system",
      "content": "You are an assistant with knowledge of U.S. state laws. Answer the questions accurately."
    },
    {
      "role": "user",
      "content": "List the states where adultery is technically illegal. Only provide a list of states with no explanation."
    }
  ],
  "ideal": "Alabama, Arizona, Florida, Idaho, Illinois, Kansas, Michigan, Minnesota, Mississippi, New York, North Carolina, Oklahoma, Rhode Island, South Carolina, Virginia, Wisconsin, Georgia"
}
Building an eval
Registering the eval2:
<eval_name>:
  id: <eval_name>.dev.v0
  description: <description>
  metrics: [accuracy]

<eval_name>.dev.v0:
  class: evals.elsuite.basic.match:Match
  args:
    samples_jsonl: <eval_name>/samples.jsonl
Eval templates
- evals/docs/eval-templates.md at main · openai/evals templates to make task creation easier
- e.g. basic: match/fuzzy-match/..
- model-graded: use a model to parse the completion into an easily parsable shape, e.g. yes/no/maybe.
Model-graded templates
Sample yaml:3
humor_likert: prompt: |- Is the following funny? {completion} Answer using the scale of 1 to 5, where 5 is the funniest. choice_strings: "12345" choice_scores: from_strings input_outputs: input: completionclosedqa: config_dict = yaml.load(yaml_path.read_text()) prompt: |- You are assessing a submitted answer on a given task based on a criterion. Here is the data: [BEGIN DATA] *** [Task]: {input} *** [Submission]: {completion} *** [Criterion]: {criteria} *** [END DATA] Does the submission meet the criterion? First, write out in a step by step manner your reasoning about the criterion to be sure that your conclusion is correct. Avoid simply stating the correct answers at the outset. Then print only the single character "Y" or "N" (without quotes or punctuation) on its own line corresponding to the correct answer. At the end, repeat just the letter again by itself on a new line. Reasoning: eval_type: cot_classify choice_scores: "Y": 1.0 "N": 0.0 choice_strings: 'YN' input_outputs: input: "completion"- Includes
- closedqa (is the answer given in the prompt?)
- battle.yaml: pairwise choice basically
- Notably, I don’t really see a way to do multiple choice using their basic eval templates, a la lm-eval
doc_to_choice.
Inference
- Completion functions: evals/docs/completion-fns.md at main · openai/evals
- generalization of “completion”, e.g. also to allow the model to open a browser or whatever
langchain/llm/text-davinci-003:
  class: evals.completion_fns.langchain_llm:LangChainLLMCompletionFn
  args:
    llm: OpenAI
    llm_kwargs:
      model_name: text-davinci-003

langchain/llm/flan-t5-xl:
  class: evals.completion_fns.langchain_llm:LangChainLLMCompletionFn
  args:
    llm: HuggingFaceHub
    llm_kwargs:
      repo_id: google/flan-t5-xl
Model types
Not immediately easily exposed, definitely supports OpenAI and LangChain and HF, but it’s not intuitive.
HF Lighteval
Running
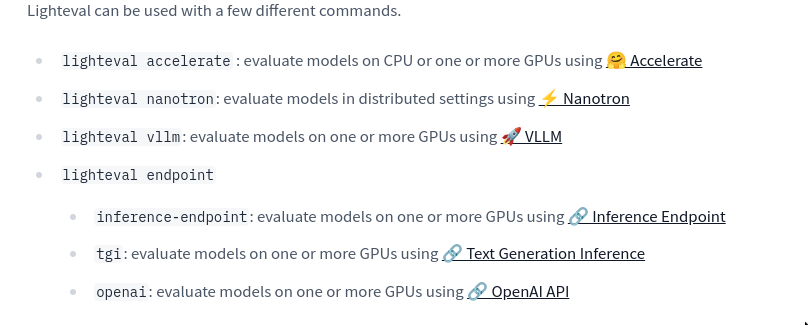
lighteval accelerate \
     "model_name=openai-community/gpt2" \
     "leaderboard|truthfulqa:mc|0|0"
The syntax:
{suite}|{task}|{num_few_shot}|{0 for strict num_few_shots, or 1 to allow a truncation if context size is too small}Task formats
- Python files: Adding a Custom Task.
- Example template:
lighteval/community_tasks/_template.py - German RAG eval: lighteval/community_tasks/german_rag_evals.py at main · huggingface/lighteval
- Currently implemented tasks: lighteval/src/lighteval/tasks at main · huggingface/lighteval
- Example task: lighteval/examples/custom_tasks_templates/custom_yourbench_task_mcq.py at main · huggingface/lighteval
    return Doc(
        instruction=ZEROSHOT_QA_INSTRUCTION,
        task_name=task_name,
        query=ZEROSHOT_QA_USER_PROMPT.format(question=line["question"], options=options),
        choices=line["choices"],
        gold_index=gold_index,
    )

yourbench_mcq = LightevalTaskConfig(
    name="HF_TASK_NAME",  # noqa: F821
    suite=["custom"],
    prompt_function=yourbench_prompt,
    hf_repo="HF_DATASET_NAME",  # noqa: F821
    hf_subset="lighteval",
    hf_avail_splits=["train"],
    evaluation_splits=["train"],
    few_shots_split=None,
    few_shots_select=None,
    generation_size=8192,
    metric=[Metrics.yourbench_metrics],
    trust_dataset=True,
    version=0,
)
Features
Inference
Model types
Many, and model configs are yamls: lighteval/examples/model_configs at main · huggingface/lighteval. For example: lighteval/examples/model_configs/litellm_model.yaml at main · huggingface/lighteval
model_parameters:
  model_name: "openai/deepseek-ai/DeepSeek-R1-Distill-Qwen-32B"
  provider: "openai"
  base_url: "https://router.huggingface.co/hf-inference/v1"
  generation_parameters:
    temperature: 0.5
    max_new_tokens: 256
    top_p: 0.9
    seed: 0
    repetition_penalty: 1.0
    frequency_penalty: 0.0
Misc
Their default prompts: lighteval/src/lighteval/tasks/default_prompts.py at main · huggingface/lighteval
HELM
- stanford-crfm/helm: Holistic Evaluation of Language Models (HELM)
- Their famous leaderboard: Holistic Evaluation of Language Models (HELM)
- Documentation: Index - CRFM HELM
Running
# Run benchmark
helm-run --run-entries mmlu:subject=philosophy,model=openai/gpt2 --suite my-suite --max-eval-instances 10
# Summarize benchmark results
helm-summarize --suite my-suite
Task formats
Features
Inference
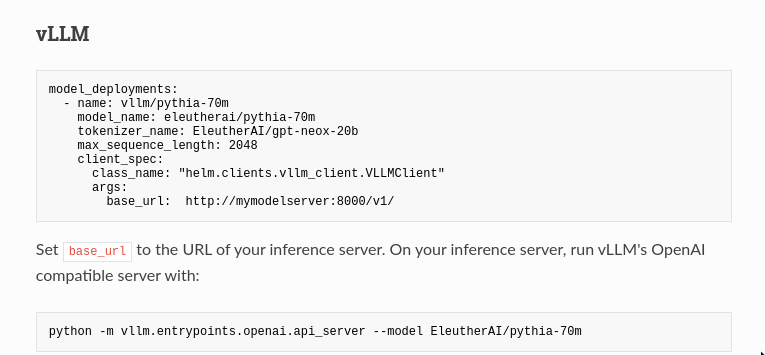
A model has metadata (description) and deployment (actually how to run it / implementation). Adding New Models - CRFM HELM Both are yamls.
HF model deployiment (but running locally!):
  - name: huggingface/gemma-2-9b-it
    model_name: google/gemma-2-9b-it
    tokenizer_name: google/gemma-2-9b
    max_sequence_length: 8192
    client_spec:
      class_name: "helm.clients.huggingface_client.HuggingFaceClient"
      args:
        device_map: auto
        torch_dtype: torch.bfloat16
I’m not certain how that connects to their Hugging Face Model Hub Integration - CRFM HELM — tl;dr only
AutoModelForCausalLM. To run:helm-run \ --run-entries boolq:model=stanford-crfm/BioMedLM \ --enable-huggingface-models stanford-crfm/BioMedLM \ --suite v1 \ --max-eval-instances 10All (many!) deployments: helm/src/helm/config/model_deployments.yaml at main · stanford-crfm/helm
vLLM example uses a OpenAI-compatible inference server
OpenCompass
- Welcome to OpenCompass’ documentation! — OpenCompass 0.4.2 documentation
- open-compass/opencompass: OpenCompass is an LLM evaluation platform, supporting a wide range of models (Llama3, Mistral, InternLM2,GPT-4,LLaMa2, Qwen,GLM, Claude, etc) over 100+ datasets.
Never heard of it but looks cool! And supports many types of evals.
Subjective Evaluation Guidance — OpenCompass 0.4.2 documentation
All configs in Python! models tasks etc.
Model types
All configs in python!
# model_cfg.py
from opencompass.models import HuggingFaceCausalLM

models = [
    dict(
        type=HuggingFaceCausalLM,
        path='huggyllama/llama-7b',
        model_kwargs=dict(device_map='auto'),
        tokenizer_path='huggyllama/llama-7b',
        tokenizer_kwargs=dict(padding_side='left', truncation_side='left'),
        max_seq_len=2048,
        max_out_len=50,
        run_cfg=dict(num_gpus=8, num_procs=1),
    )
]
OpenAI:
from opencompass.models import OpenAI

models = [
    dict(
        type=OpenAI,                             # Using the OpenAI model
        # Parameters for `OpenAI` initialization
        path='gpt-4',                            # Specify the model type
        key='YOUR_OPENAI_KEY',                   # OpenAI API Key
        max_seq_len=2048,                        # The max input number of tokens
        # Common parameters shared by various models, not specific to `OpenAI` initialization.
        abbr='GPT-4',                            # Model abbreviation used for result display.
        max_out_len=512,                         # Maximum number of generated tokens.
        batch_size=1,                            # The size of a batch during inference.
        run_cfg=dict(num_gpus=0),                # Resource requirements (no GPU needed)
    ),
]
OpenCompass VLMEvalKit
Same creators as the above one, multimodal eval.
DeepEval
- confident-ai/deepeval: The LLM Evaluation Framework
- basically unit-test for LLMs — optionally literally using pytest!
- “large amount of metrics” usable with “ANY LLM of your choice”
- includes RAG tool use etc.
- have their free cloud thingy to share reports etc., optional but they push it heavily. Something like wandb — visualize scores compare etc.
- Supports evaluating LlamaIndex | DeepEval
Tasks
From their README:
import pytest
from deepeval import assert_test
from deepeval.metrics import GEval
from deepeval.test_case import LLMTestCase, LLMTestCaseParams

def test_case():
    correctness_metric = GEval(
        name="Correctness",
        criteria="Determine if the 'actual output' is correct based on the 'expected output'.",
        evaluation_params=[LLMTestCaseParams.ACTUAL_OUTPUT, LLMTestCaseParams.EXPECTED_OUTPUT],
        threshold=0.5
    )
    test_case = LLMTestCase(
        input="What if these shoes don't fit?",
        # Replace this with the actual output from your LLM application
        actual_output="You have 30 days to get a full refund at no extra cost.",
        expected_output="We offer a 30-day full refund at no extra costs.",
        retrieval_context=["All customers are eligible for a 30 day full refund at no extra costs."]
    )
    assert_test(test_case, [correctness_metric])
Models
- the usual ones, including neat HF support k The vLLM bit describes using an openAI-compatible endpoints: vLLM | DeepEval - The Open-Source LLM Evaluation Framework, same as for LMStudio
deepeval set-local-model --model-name=<model_name> \
--base-url="http://localhost:8000/v1/" \
--api-key=<api-key>
Misc
- Can do component-based evals through
@observedecorators, “avoiding rewriting your app just for testing” - Supports many vector databases eval for RAG retrieval eval
Other stuff
FastChat MTBench
- FastChat/fastchat/llm_judge at main · lm-sys/FastChat
- pure Python, llm-as-a-judge
- one python script to generate answers, another to get LLM judgements, a third to calculate results and draw plots — neat pattern
- FastChat powers LLM Arena, and also provides an OpenAI-compatible API for the models it supports
Autoevals
- braintrustdata/autoevals: AutoEvals is a tool for quickly and easily evaluating AI model outputs using best practices.
- python+TS, no runner but framework
- API-first, doesn’t try to run local inference, which again I like
- Generally I really like it
Pydantic evals
- Evals - PydanticAI
- Yet another unit tests for LLM approach, flexible, supports LLM-as-a-judge
MORE
Ragas
- explodinggradients/ragas: Supercharge Your LLM Application Evaluations 🚀
- e.g. AspectCritic Metrics - Ragas
-
https://github.com/EvolvingLMMs-Lab/lmms-eval/blob/main/examples/models/openai_compatible.sh: ↩︎
-
https://github.com/openai/evals/blob/main/evals/registry/modelgraded/closedqa.yaml[evals/evals/registry/modelgraded/humor.yaml at main · openai/evals](https://github.com/openai/evals/blob/main/evals/registry/modelgraded/humor.yaml); https://github.com/openai/evals/blob/main/evals/registry/modelgraded/closedqa.yaml ↩︎
-
Day 2345 (03 Jun 2025)
Deploying FastChat locally with litellm and GitHub models
Just some really quick notes on this, it’s pointless and redundant but I’ll need these later
- lm-sys/FastChat: An open platform for training, serving, and evaluating large language models. Release repo for Vicuna and Chatbot Arena.
- LiteLLM Proxy Server (LLM Gateway) | liteLLM
LiteLLM
Create .yaml with a github models model:
model_list:
  # - model_name: github-Llama-3.2-11B-Vision-Instruct # Model Alias to use for requests
  - model_name: minist # Model Alias to use for requests
    litellm_params:
      model: github/Ministral-3B
      api_key: "os.environ/GITHUB_API_KEY" # ensure you have `GITHUB_API_KEY` in your .env
After setting GITHUB_API_KEY,
litellm --config config.yamlFastChat
- Install FastChat, start the controller:
python3 -m fastchat.serve.controller
- FastChat model config:
{ "minist": { "model_name": "minist", "api_base": "http://0.0.0.0:4000/v1", "api_type": "openai", "api_key": "whatever", "anony_only": false } }- Run the webUI
python3 -m fastchat.serve.gradio_web_server_multi --register-api-endpoint-file ../model_config.json- Direct chat now works!
-
Day 2343 (01 Jun 2025)
Переміщення бухгалтерії 1С 1C
TIL about 1C when I had to move it from one windows laptop to another. First and last windows post here hopefully
Ref: 1С – как перенести базу на другой компьютер
Long story short:
- 1C v 7.7 from 1999 can be literally copied to another laptop and it works, windows is good at this.
- the database is also a directory, which is usually shown when you start 1C and choose the DB to open
- that directory can be copied
- I THINK it’s good karma if the path on both computers is identical, but am not certain
- if the version matches that should be it
- no idea how to check if it worked :)
-
Day 2339 (28 May 2025)
Terminal test support for bold italic colors etc
echo -e '\e[1mbold\e[22m'
echo -e '\e[2mdim\e[22m'
echo -e '\e[3mitalic\e[23m'
echo -e '\e[4munderline\e[24m'
echo -e '\e[4:1mthis is also underline (since 0.52)\e[4:0m'
echo -e '\e[21mdouble underline (since 0.52)\e[24m'
echo -e '\e[4:2mthis is also double underline (since 0.52)\e[4:0m'
echo -e '\e[4:3mcurly underline (since 0.52)\e[4:0m'
echo -e '\e[4:4mdotted underline (since 0.76)\e[4:0m'
echo -e '\e[4:5mdashed underline (since 0.76)\e[4:0m'
echo -e '\e[5mblink (since 0.52)\e[25m'
echo -e '\e[7mreverse\e[27m'
echo -e '\e[8minvisible\e[28m <- invisible (but copy-pasteable)'
echo -e '\e[9mstrikethrough\e[29m'
echo -e '\e[53moverline (since 0.52)\e[55m'

echo -e '\e[31mred\e[39m'
echo -e '\e[91mbright red\e[39m'
echo -e '\e[38:5:42m256-color, de jure standard (ITU-T T.416)\e[39m'
echo -e '\e[38;5;42m256-color, de facto standard (commonly used)\e[39m'
echo -e '\e[38:2::240:143:104mtruecolor, de jure standard (ITU-T T.416) (since 0.52)\e[39m'
echo -e '\e[38:2:240:143:104mtruecolor, rarely used incorrect format (might be removed at some point)\e[39m'
echo -e '\e[38;2;240;143;104mtruecolor, de facto standard (commonly used)\e[39m'

echo -e '\e[46mcyan background\e[49m'
echo -e '\e[106mbright cyan background\e[49m'
echo -e '\e[48:5:42m256-color background, de jure standard (ITU-T T.416)\e[49m'
echo -e '\e[48;5;42m256-color background, de facto standard (commonly used)\e[49m'
echo -e '\e[48:2::240:143:104mtruecolor background, de jure standard (ITU-T T.416) (since 0.52)\e[49m'
echo -e '\e[48:2:240:143:104mtruecolor background, rarely used incorrect format (might be removed at some point)\e[49m'
echo -e '\e[48;2;240;143;104mtruecolor background, de facto standard (commonly used)\e[49m'

echo -e '\e[21m\e[58:5:42m256-color underline (since 0.52)\e[59m\e[24m'
echo -e '\e[21m\e[58;5;42m256-color underline (since 0.52)\e[59m\e[24m'
echo -e '\e[4:3m\e[58:2::240:143:104mtruecolor underline (since 0.52) (*)\e[59m\e[4:0m'
echo -e '\e[4:3m\e[58:2:240:143:104mtruecolor underline (since 0.52) (might be removed at some point) (*)\e[59m\e[4:0m'
echo -e '\e[4:3m\e[58;2;240;143;104mtruecolor underline (since 0.52) (*)\e[59m\e[4:0m'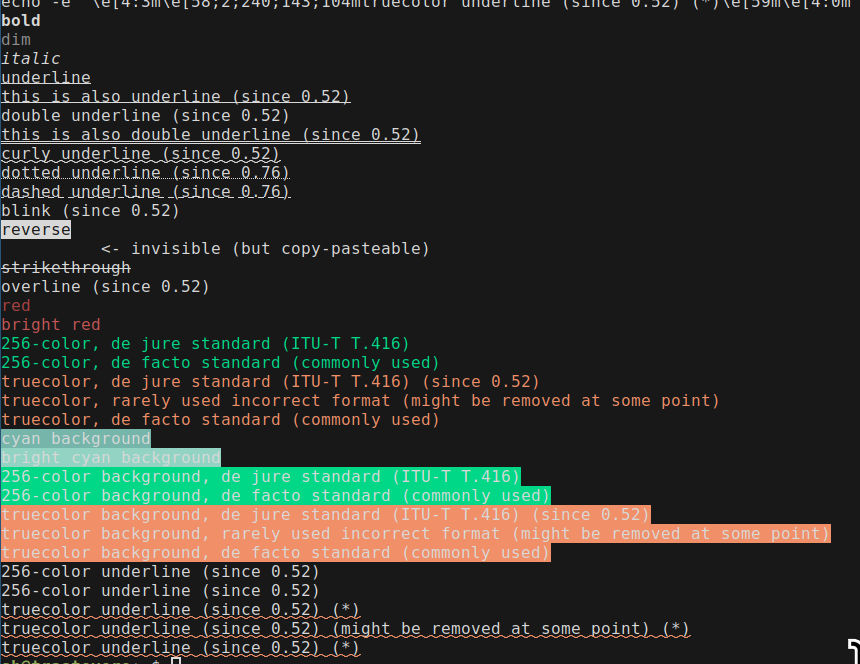
alacritty terminal
Kitty was really slow to start and this has been bugging me. Especially setting up a new system, using the default gnome-terminal, and seeing it appear instantly.
Kitty’s single instance mode (also
-1) decreased start from 400ms to 300, still too much.time alacritty -e bash -c exit time gnome-terminal -e "bash -c exit" time kitty --single-instance bash -c exitNew best friend: Alacritty
Saw Alacritty mentioned and it’s awesome. Has everything I wanted from or set up for kitty. Kitty is more configurable (I think), but I’m not missing anything at all so far.
Spawn instance in same directory
I used to have a separate command for that!
[keyboard]
bindings = [
   { key = "Return", mods = "Control|Shift", action = "SpawnNewInstance" }
]
Hints
Updated the default config to copy instead of launch, use better letters, and do file paths together with URIs:
[hints]
alphabet = "aoeusndh"

hints.enabled
action = "Copy"
# command = "xdg-open" # On Linux/BSD
hyperlinks = true
post_processing = true
persist = false
mouse.enabled = true
binding = { key = "N", mods = "Control|Shift" }

# adds file paths as well
regex = '(?:(?:ipfs:|ipns:|magnet:|mailto:|gemini://|gopher://|https?://|news:|git://|ssh:|ftp:|file:)[^\u0000-\u001F\u007F-\u009F<>"\s{}\-\^⟨⟩`\\]+|(?:(?:\.\.?/)+|/)[^\u0000-\u001F\u007F-\u009F<>"\s{}\-\^⟨⟩`\\]+)'
# regex = "(ipfs:|ipns:|magnet:|mailto:|gemini://|gopher://|https://|http://|news:|file:|git://|ssh:|ftp://)[^\u0000-\u001F\u007F-\u009F<>\"\\s{-}\\^⟨⟩`\\\\]+"
Vim mode
<C-S-Space>runs a vim-ish mode on the text, one can then copy etc. with all usual movements!In kitty I had to do vim as scrollback pager etc. (old code below, prolly broken, didn’t use it because too complex)
For later
Previously
Some old configs from kitty, for reference:
## Bindings

# https://sw.kovidgoyal.net/kitty/index.html#kittens
map kitty_mod>f1 launch --stdin-source=@screen_scrollback --stdin-add-formatting less +G -R

## Hints
# File paths
map kitty_mod+n>f kitten hints --type path --program @

# IPs (+ with ports)
map kitty_mod+n>i kitten hints --type regex --regex [0-9]+(?:\.[0-9]+){3} --program @
map kitty_mod+n>p kitten hints --type regex --regex [0-9]+(?:\.[0-9]+){3}:[0-9]+ --program @

# CLI Commands
# map kitty_mod+n>c kitten hints --type regex --regex "(\$|>)(.+)(?:\n|\s*$)?" --program @
# This version copies up to the vim mode indicator
# map kitty_mod+n>c kitten hints --type regex --regex "(\$|>)(.+?)(?:\n|\s+$|\s+(?:INS|VIS|REP|SEA))" --program @
# map kitty_mod+n>c kitten hints --type regex --regex "\$(.+)" --program @

# Linenum
map kitty_mod+n>l kitten hints --type line --program @
Scrollback/vim:
# https://sw.kovidgoyal.net/kitty/index.html#kittens
map kitty_mod>f1 launch --stdin-source=@screen_scrollback --stdin-add-formatting less +G -R
scrollback_pager vim - -c "w! /tmp/kitty_scrollback_sh" -c "term ++curwin cat /tmp/kitty_scrollback_sh"
Bash and zsh command substitution
- After running a command (e.g.
ag whatever,^ag^rgre-runs it substituting the first part with the second — sorg whatever) - Fish doesn’t (want to) support this: Frequently asked questions — fish-shell 4.0.1 documentation
Ty BB for this
- After running a command (e.g.