serhii.net
In the middle of the desert you can say anything you want
-
Day 2089 (20 Sep 2024)
File is not reserved in python anymore
Is ‘file’ a keyword in python? - Stack Overflow
TL;DR python3 doesn’t care about
file, regardless of what syntax highlighters think about this.
-
Day 2082 (13 Sep 2024)
flake8 and docstrings
TL;DR:
- pydocstyle != flake8-docstrings · PyPI!
- read the pypy documentation
docstring-convention=googlein flake8 config file, ignores there as well together with the rest.
pydocstyle / python-flake8-docstrings is a thing. Forgot I had it installed and spent a lot of time trying to understand pycharm’s output
Usage — pydocstyle 0.0.0.dev0 documentation flake8-docstrings · PyPI
To ignore things, you don’t do:
[pydocstyle]
convention = google
ignore = D401
It’s either ignore or convention. Which quietly happened in the background, and I thought it doesn’t read my config file since D401 was still shown.
Correct would be this:
[pydocstyle]
convention = google
add-ignore = D401
EDIT GodDAMN it, pydocsyle parsing a config file doesn’t mean that flake8(-..docstring) will.
Reading the flake8 plugin docs, I should add THIS and to flake8 config file. Ignores also are set up there using the usual way.
docstring-convention=googleAnd the pydoctest config file search and
add-ignoreis irrelevant. God lost so much time to this
-
Day 2079 (10 Sep 2024)
3D Slicer reloading a scriptedCLI module
EDIT: this may be all wrong, in the debugger I can just edit the code and it gets automatically used by slicer — logical, since it’s just a CLI script.
It’s the .xml with the interface that’s problematic and it can’t be reloaded using the method below, or at least I couldn’t.
A scriptedcli module imported to Slicer doesn’t show for me the usual “reload” buttons as seen in scripted modules in dev. mode. To develop, I need my changes I need to reload it w/o restarting 3dslicer.
Based on this more complete example1 linked in the script repository2
>>> mpath = "/full/path/to/the/my_module.py"
>>> factoryManager = slicer.app.moduleManager().factoryManager()
>>> factoryManager.registerModule(qt.QFileInfo(mpath))
>>> factoryManager.loadModules(["my_module"])
True
BONUS:
- To debug such a module using pycharm, adding the pydev lines inside it works (and official slicer debug extension doesn’t):
import pydevd_pycharm
pydevd_pycharm.settrace('localhost', port=5678, stdoutToServer=True, stderrToServer=True)
-
Day 2074 (05 Sep 2024)
Developing a 3D Slicer extension
Links
- GUI
Debugging
TL;DR Pycharm Professional instructions work
- These instructions: SlicerRt/SlicerDebuggingTools: Extension for 3D Slicer containing various tools for module development and debugging1
- No need to change anything in module code
- During debugging everything freezes
- You can use pycharm python CLI to look around etc. — neat!
not TL;DR
- SlicerRt/SlicerDebuggingTools: Extension for 3D Slicer containing various tools for module development and debugging1
- needs pycharm Pro
- SlicerDebuggingTools/PyDevRemoteDebug/PyDevRemoteDebug.py at master · SlicerRt/SlicerDebuggingTools
- source of the 3dslicer bits
- pdb-attach · PyPI can attach to random programs,
os.getpid()is my friend
- Documentation/4.5/Developers/FAQ/Python Scripting - Slicer Wiki at some point it was possible to use python-remote-pdb
- ionelmc/python-remote-pdb: Remote vanilla PDB (over TCP sockets). 2y ago last commit
- I can use these same instructions mostly for pdb-attach, I see no reason it shouldn’t work, python is python
- it Kiiiinda works but breaks after the first button
Giving up for now- Update: installed Pycharm Pro, works!
- Pycharm Pro egg was in
/opt/pycharm-professional/debug-eggs/pydevd-pycharm.egg
- Pycharm Pro egg was in
Basics
Starting Slicer
Loads the module automatically (for some reason doing it manually doesn’t preserve it across restarts?..)
Slicer --additional-module-path /path/to/my/extension/one/lower/than/what/i/would/pick/in/Slicer/GUILogging
- Not directly mentioned in the help because they state it’s always better to use the debugger2
- Slicer/Base/Python/slicer/slicerqt.py at main · Slicer/Slicer has the slicer setup
- I can do
logging.warning("test")in the python console and it works - Slicer settings allow changing the loglevel of its python console!
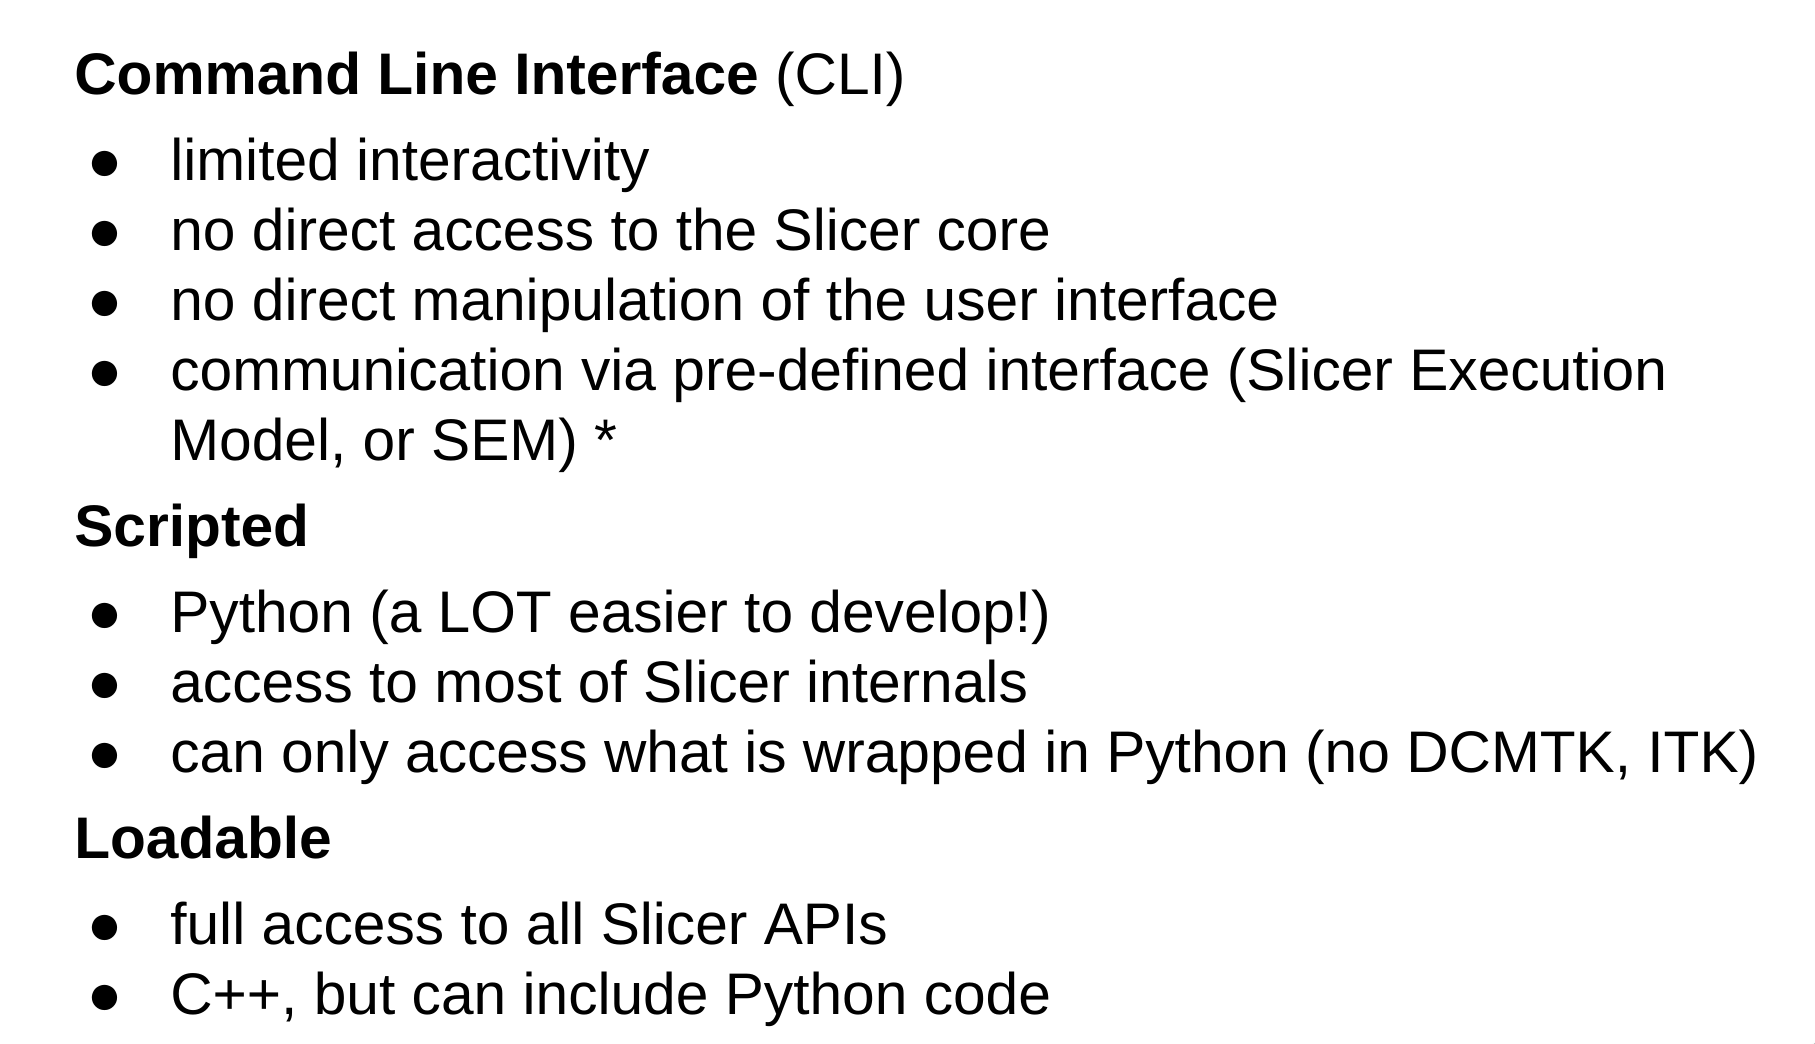
Module types: CLI modules
Different types of modules exist: Module Overview — 3D Slicer documentation
In the first tests there was a lot of latency.
Solution: CLI modules (not extensions) that can run in the background and whose status can be queried, which can be added to new extension from extension editor.
Now I understad this better:
- CLI modules are simple I/O, non-blocking, that’s where the networkig logic should go to
- scripted are python scripts with GUIs
- This bit about running CLI in the backgroundPython FAQ — 3D Slicer documentation
Looking into the sample code
Module of type scripted
- Created an extension of type cmake, to which I added a module of type
scripted. It’s the sample thresholding extension - Sample data
- It shows how to add sample data to the extension for testing
- It can then be found in the Sample Data module, named after the extension itself!
Module of type scriptedCLI
-
I hope it’s the same as type CLI, but only with python
-
Is a CLI script w/ an XML that has module metadata + examples
- CLI module goes in the same examles menu
- and a basic UI has been generated for it? Wow
- Running it from the UI actually shows a progress bar and it doesn’t block the interface! Woohoo!
-
Adding it added it to CMakeLists.xml:
add_subdirectory(my_scripted_cli) -
python dev tools actually show the CLI used to run a CLI module!
- the input arguments are filepaths, and slicer automatically generates and then deletes temporary files for this when running
-
can’t debug it the usual way, I guess I’ll have to add the pydevd-pycharm things to the code
[VTK] /opt/3dslicer/bin/python-real /home/.../cli_model_service.py /tmp/Slicer-sh/IACHCI_vtkMRMLScalarVolumeNodeD.nrrd 1 /tmp/Slicer-sh/IACHCI_vtkMRMLScalarVolumeNodeF.nrrd(Auto-creating) GUI
-
Slicer/Docs/developer_guide/parameter_nodes/gui_creation.md at main · Slicer/Slicer seems interesting
-
CLI modules have an interface specified by the .xml file, and the interface is generated based on it
couldn’t find any documentation onhow to write the XML: Documentation/Nightly/Developers/SlicerExecutionModel - Slicer Wiki
-
Bits about the XML
channelis eitherinputoroutput, and only for pics.- No parameter names, just their
index
-
If I read the volume as volume, it uses the
.nrrdfile extension by default — and I want.nii- Script repository deals with these settings, but I can’t use them from within a CLI module Script repository — 3D Slicer documentation
Auto-loading the module at startup
Module from console with arguments - Support - 3D Slicer Community
Slicer.exe --python-code "selectModule('SampleData'); getModuleGui('SampleData').setCategoryVisible('BuiltIn', False)"File operations
Script repository — 3D Slicer documentation:
# Create a new directory where the scene will be saved into
import time
sceneSaveDirectory = slicer.app.temporaryPath + "/saved-scene-" + time.strftime("%Y%m%d-%H%M%S")
if not os.access(sceneSaveDirectory, os.F_OK):
  os.makedirs(sceneSaveDirectory)
Inspiration
- User_Manual.md · develop · OpenDose / SlicerOpenDose3D · GitLab
- openDose3D is a cool example extension that shows many things
- SlicerTotalSegmentator/TotalSegmentator/TotalSegmentator.py at main · lassoan/SlicerTotalSegmentator
		outputSegmentation.AddDefaultStorageNode()
		outputSegmentation.GetStorageNode().SetFileName(output_segmentation_path)
		outputSegmentation.GetStorageNode().ReadData(outputSegmentation)
Useful bits from documentation
- There’s a node type for tables
- statistics become a table
- also: many modules exist
- Documentation/Nightly/Extensions/MeshStatistics - Slicer Wiki / DCBIA-OrthoLab/MeshStatisticsExtension
- does a lot including creating a table GUI programmatically and CSV export etc.
- Documentation/Nightly/Extensions/MeshStatistics - Slicer Wiki / DCBIA-OrthoLab/MeshStatisticsExtension
- Colors: are not just colors, but class/label names as well
-
Day 2066 (28 Aug 2024)
3dslicer extension deployment options
-
Main links
-
slicerrc.py is a thing! sample: 3D-Slicer-Scripts/.slicerrc.py at master · jzeyl/3D-Slicer-Scripts · GitHub
-
Slicer custom application deployment to many computers - Development - 3D Slicer Community
SlicerQReads.exe --python-code "folder='S:\SlicerQREADS\TestImages'; import os; slicer.util.loadVolume(folder + '/' + os.listdir(folder)[0], {'singleFile': False})"- alternatively:
Slicer.exe --python-script "/full/path/to/myscript.py" --no-splash --no-main-window3
-
Slicer can run in Docker4
-
Slicer can run in webbrowser5
-
Slicer can run in jupyter5, including partially (e.g. only a single view etc!)
Slicer
--help:--testing Activate testing mode. It implies --disable-settings and --ignore-slicerrc. (default: false) --disable-python Disable python support. This is equivalent to build the application with Slicer_USE_PYTHONQT=OFF. --python-script Python script to execute after slicer loads. --python-code Python code to execute after slicer loads. -c Python code to execute after slicer loads. By default, no modules are loaded and Slicer exits afterward. --ignore-slicerrc Do not load the Slicer resource file (~/.slicerrc.py). --additional-module-path Additional module path to consider when searching for modules to load. --additional-module-paths List of additional module path to consider when searching for modules to load.-
Slicer modules — todo, CLI things with easy arguments
-
Slicer extensions/modules creation
- Developing extension in 3D Slicer - Google Slides presentation
-
- Sharing extensions there: TL;DR use slicer publishing thing to publish to own repo, then PR to slicer main extensions index repo (GitHub - Slicer/ExtensionsIndex: Slicer extensions index)
- Sample JSON: ExtensionsIndex/SurfaceWrapSolidify.json at main · Slicer/ExtensionsIndex · GitHub
- Pull requests · Slicer/ExtensionsIndex has code for existing recent extensions that may be useful
-
- Developing extension in 3D Slicer - Google Slides presentation
-
Extension manager
- Extensions Manager — 3D Slicer documentation 2
- Can have different extension server URI!
- Updating:
- Extensions Manager — 3D Slicer documentation
- TL;D/R extension manager can do that incl. automatically
-
CI/CD exists for extensions published officially
-
Misc:
- Script repository — 3D Slicer documentation has sample uses of slicer CLI!
- 3D-Slicer-Scripts/.slicerrc.py at master · jzeyl/3D-Slicer-Scripts · GitHub
-
Script repository — 3D Slicer documentation has this:
-
This code snippet can be useful for sharing code in development without requiring a restart of Slicer.
- gist.githubusercontent.com/pieper/a9c0ba57de3833c9f5aea68247bda597/raw/82d73d85340ffd205b01fc339b096a8607cfe02b/InstallSlicerModuleFromGit.py
- TODO, does this mean updating extensions without restart?
- EDIT: I can reload the code of the extension as-is
-
-
Fazit:
- extensions can be built (C++) or not (python)
- enabling:
- add to CLI path to “additional module paths” path to place where .py extension is locally
- git pull etc.?
- get a .zip from the repo and use the python code to get it from there and update
- make our own extension manager repo thing and use automatic updating functionality
- add to CLI path to “additional module paths” path to place where .py extension is locally
-
Other bits
- Making Slicer simpler by hiding many things: Simple 3D Slicer based image viewer
- And hiding a module UI: Slicer/Modules/Scripted/DICOMPlugins/DICOMScalarVolumePlugin.py at 022a4f1a347ebb24509a50f6c8928ae26d3c5955 · Slicer/Slicer
-
Run Slicer in your web browser - as a Jupyter notebook or as a full application - Announcements - 3D Slicer Community ↩︎
-
GitHub - Slicer/SlicerDocker: Build, package, test, and run 3D Slicer and Slicer Extensions in Docker. ↩︎
-
Run Slicer in your web browser - as a Jupyter notebook or as a full application - Announcements - 3D Slicer Community ↩︎ ↩︎
-
-
Day 2044 (06 Aug 2024)
rsync on file changes with inotifywatch
inotifywait(1) - Linux man page
#!/bin/sh
while inotifywait --format '%:e %f' p.* *.bib; do
  sleep 1  # files get moved often
  echo "rsync!"
  rsync -avzirh --progress  p.* *.bib me@server.net:dir
done
-
Day 2043 (05 Aug 2024)
Boltctl monitor exists
boltctl monitorshows changes as they happens — nice when something breaks. I used to do a lot ofwatch boltctl listbefore in this exact scenario(having a
monitorsubcommand in your thing says a lot about stuff, actually, — the best interpretation is that it’s written with developers in mind)
-
Day 2041 (03 Aug 2024)
Quarto CSS grid to better position absolute elements
Very proud of this idea, haha :)
For absolute positioned elements one needs to “guess” the correct sizes etc., may not be trivial. Using a pixel ruler won’t help because the .absolute coords don’t map to the screen ones.
Solution:
.grid {
  // https://stackoverflow.com/questions/4191260/drawing-a-grid-using-css
  background-image:
    repeating-linear-gradient(lightblue 0 2px, transparent 2px 100%),
    repeating-linear-gradient(90deg, lightblue 0 2px, transparent 2px 100%);
  background-size: 50px 50px;
  //border: 2px solid red;
}

.smallgrid {
  background-image:
    repeating-linear-gradient(#ccc 0 1px, transparent 1px 100%),
    repeating-linear-gradient(90deg, #ccc 0 1px, transparent 1px 100%);
  background-size: 10px 10px;
  width: 100%;
  height: 100%;
}
::::: {.absolute left=0 right=0 top=0 bottom=0 .grid} ::: {.smallgrid} ::: :::::
It’s not exactly aligned but close enough to judge the widths and heights involved!
Rectangle in the pic is:
:::: {.redrect .absolute right=200 top=130 width=200 height=100}
::::
(And the small grid can be omitted if not needed by removing the div in the middle. )
For bonus points, can be saved as a file and included if needed:
{\{< include ../_shared/smallgrid.qmd >}\}ALSO:
// show the border of the slide
.reveal .slides {
  border: 1px dashed red;
}
-
Day 2040 (02 Aug 2024)
Quarto vertical align one last time
DAMN.
:::: {layout="1,1,1],[1],[1,1,1" layout-valign="center"}if it’s a layout I do get a valign thing. I just have to use layouts, not columns. Damn.
-
Day 2039 (01 Aug 2024)
quarto positioning SVG absolute
This doesn’t work on SVGs for me:
{.absolute top=0 left=0}This does:
::: {.absolute top=0 left=0}  :::